
|
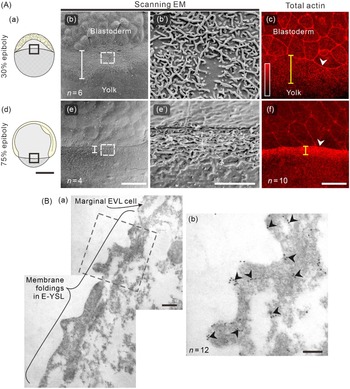
Fig. 1 Morphology of the membrane surface protrusions and localization of actin in the E-YSL during epiboly. (Aa, Ad) Schematic illustrations of embryos at (Aa) 30% and (Ad) 75% epiboly. The regions bounded by the black squares show the regions imaged using scanning electron microscopy (SEM; in panels Ab, Ae) and confocal microscopy of rhodamine–actin fluorescence (in panels Ac, Af), at (Ab, Ac) 30% epiboly and (Ae, Af) 75% epiboly. The size of the region encompassing the membrane surface protrusions and punctate actin band are indicated by white and yellow measurement lines, respectively. In (Ab, Ae) the regions bounded by the white rectangles are shown at a higher magnification in (Ab′, Ae′). In (Ac, Af), the white arrowheads indicate the leading margins of the enveloping layer cells. (B) Visualization of actin in the E-YSL using immunogold labelling in conjunction with transmission electron microscopy (TEM). (Ba) The surface membrane protrusions in the E-YSL and part of a marginal EVL cell are shown. The region bounded by the black square is shown at a higher magnification in (Bb). In (Bb), the black arrowheads indicate the localization of actin clusters. Scale bars are 250 µm (Aa, Ad), 50 µm (Ab, Ac, Ae, Af), 10 µm (Ab′, Ae′), 1 µm (Ba), and 0.1 µm (Bb).