
- Title
-
Identification of an adverse outcome pathway (AOP) for chemical-induced craniofacial anomalies using the transgenic zebrafish model
- Authors
- Liu, S., Kawanishi, T., Shimada, A., Ikeda, N., Yamane, M., Takeda, H., Tasaki, J.
- Source
- Full text @ Toxicol. Sci.
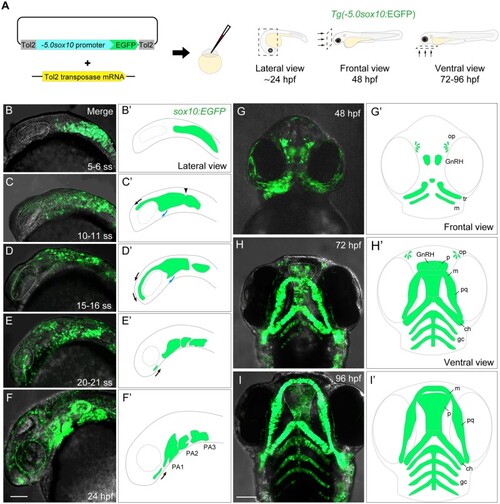
Generation and characterization of the |
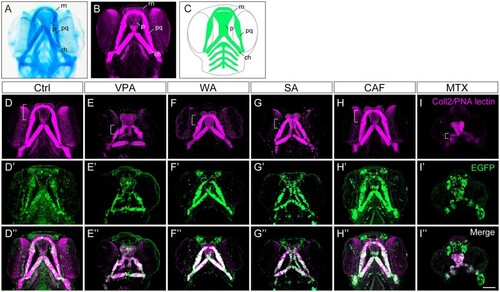
Craniofacial anomalies were identified in teratogen-treated |
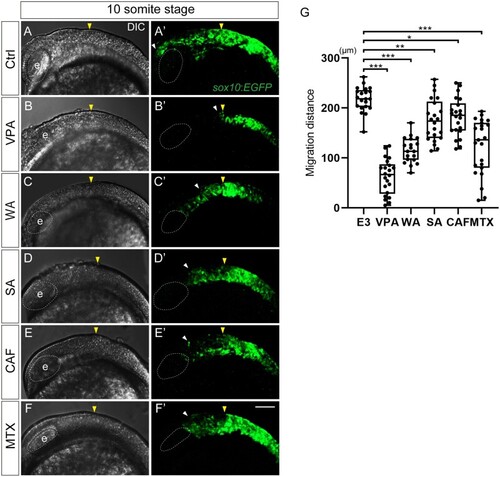
CNCC migration was inhibited in teratogen-treated |
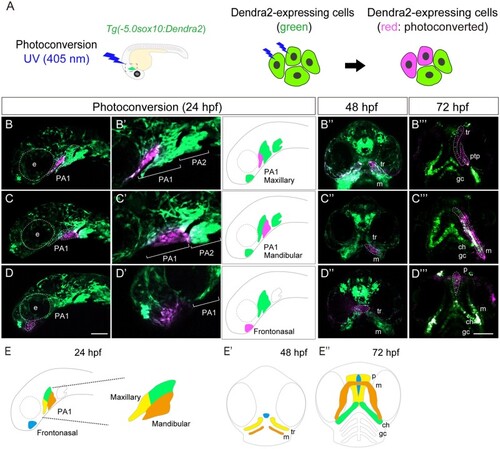
Lineage tracing of CNCCs in PA1 and frontonasal prominence using |
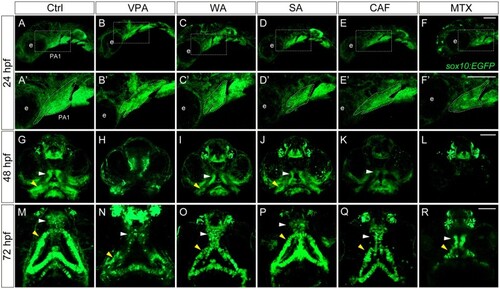
Changes in the morphology of craniofacial anomalies in teratogen-treated |
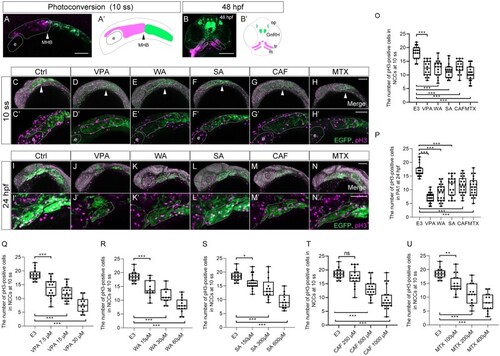
Cell proliferation was decreased in the migratory and premigratory CNCCs and CNCCs in the PA1 by teratogen treatment. (A, B) The anterior CNCCs (magenta in panel A) were labeled at 10 ss and subsequently differentiated into maxillary (trabeculae), mandibular (Meckel’s cartilage) and frontonasal prominence at 48 hpf (magenta in panel B). (A′, B′) A schematic diagram of the lineage tracing of the anterior CNCCs. Magenta and green indicate the photoconverted region and intact region, respectively. White and black arrowheads in panels A and A′ represent the position of the midbrain-hindbrain boundary (MHB). (C–N′) Immunofluorescence images of mitotic premigratory and migratory CNCCs at 10 ss (C–H′) and 24 hpf (I–N′). VPA-, WA-, SA-, CAF-, and MTX-treated embryos were stained with anti-GFP and anti-phospho-histone H3 (pH3) antibodies. Mitotic premigratory and migratory CNCCs were decreased by teratogen treatment (C–H′). (C′–H′) Magnified view of the panels C–H. Mitotic CNCCs in the PA1 were decreased by teratogen treatment. (I′–N′) Magnified view of the panels I–N. Green represents the CNCCs at 10 ss and the CNCCs in the PA1 at 24 hpf. Magenta indicates the mitotic cells stained with anti-pH3 antibody. White dotted lines trace the eye, the region of the anterior CNCCs at 10 ss and PA1 at 24 hpf. (O, P) Quantification of the number of pH3-positive CNCCs in the area at 10 ss (O) and PA1 at 24 hpf (P). |
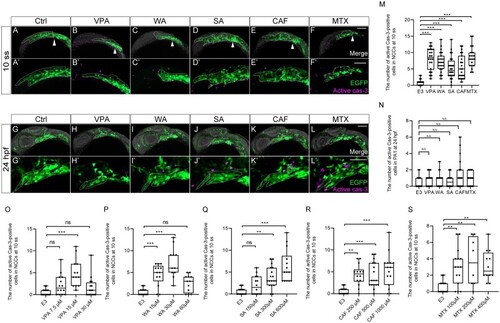
Apoptosis was increased in premigratory and migratory CNCCs, but not in CNCCs in PA1. (A–L′) Immunofluorescence images of VPA, WA, SA, CAF, and MTX-treated embryos that were stained with anti-active caspase 3 (active cas-3) and anti-GFP antibody at 10 ss (A–F′) and 24 hpf (G–L′). (A–F′) Apoptosis in premigratory and migratory CNCCs was increased by teratogen treatment. White arrowheads indicate the midbrain-hindbrain boundary (MHB). (A′–F′) Magnified view of the panels A–F. (G–L) Apoptotic CNCCs in PA1 were not significantly increased by teratogen treatment. (G′–L′) Magnified view of the panels G–L. Green represents the premigratory and migratory CNCCs at 10 ss and the CNCCs in the PA1 at 24 hpf. Magenta indicates the apoptotic CNCCs stained with anti-active cas-3 antibody. White dotted lines trace the eye and the region of the anterior CNCCs at 10 ss and PA1 at 24 hpf. (M, N) Quantitation of the number of active cas-3-positive CNCCs at 10 ss (M) and PA1 at 24 hpf (N). |
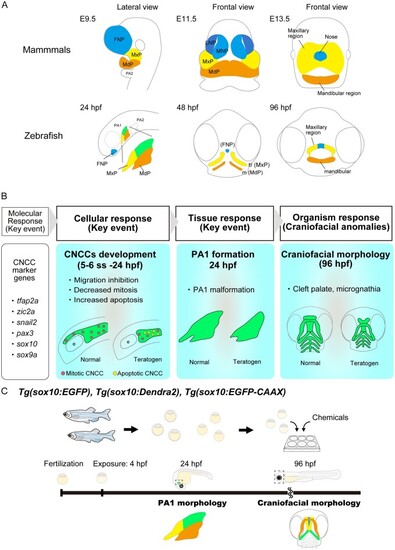
Conserved craniofacial morphogenesis during the pharyngeal stage and the AOP of craniofacial anomalies identified in the present study. (A) Schematic comparison of craniofacial morphogenesis between mammals (mouse) and zebrafish. Zebrafish and mammals share conserved craniofacial morphogenesis. At the pharyngeal stage, the frontonasal prominence (FNP), maxillary prominence (MxP) and mandibular prominence (MdP) are formed in both species. FNP and each region in the PA1 differentiate into craniofacial elements. (B) Identified AOP of chemical-induced craniofacial anomalies. (C) AOP-based teratogenicity assay utilizing the |