FIGURE SUMMARY
Title

Exploring association of melanoma-specific Bcl-xL with tumor immune microenvironment

Authors
Lucianò, A.M., Di Martile, M., Pérez-Oliva, A.B., Di Caprio, M., Foddai, M.L., Buglioni, S., Mulero, V., Del Bufalo, D.
Source
Full text @ J. Exp. Clin. Cancer Res.

A) Representative images of immunohistochemical analysis of F4/80, CD206 and Bcl-xL expression in melanoma control (Mneo) and Bcl-xL overexpressing (Mxl90) tumour-bearing mice, performed 30 days after subcutaneous cell injection (20X magnification), and B) relative quantification of peritumoral (PT) and intratumoral (IT) macrophage infiltration by F4/80 and CD206 staining. The results are reported as mean score: score 0, no detectable infiltrate; score 1, low infiltrate; score 2, moderate infiltrate; score 3, high or very high infiltrate. p-values were calculated between control and Bcl-xL overexpressing tumours. C) Representative images of Mneo and Mxl90 cells 5 days after injection in the yolk sac of 2 days post fertilization Tg (mpeg1: Cherry/tnfa: GFP) zebrafish larvae, and D) relative quantification of M1 (mCherry+/eGFP+) and M2 (mCherry+/eGFP-) macrophages recruitment in the tail.  B,D) Each dot (•) indicates an experimental point, *p < 0.05, ***p < 0.01; ns, no significant differences

A) qRT-PCR analysis of CD163, CD206, CCL1, CCL22, IL-10, ARG-1, IL-12, CD86, iNOS and HLA levels in M-DM after 24 h exposure to conditioned medium (CM) from control (Mneo) or Bcl-xL overexpressing (Mxl90, Mxl7) melanoma cells. The results are reported as percentage of mRNA variation in macrophages exposed to CM derived from Bcl-xL overexpressing cells versus control ones. B) TGF-β protein secretion quantified by ELISA essay in M-DM stimulated as reported in A). The results are reported as fold of TGF-β release in M-DM exposed to CM from Bcl-xL overexpressing cells versus control ones. A,B) p-values were calculated between M-DM exposed to CM from Bcl-xL overexpressing cells and those exposed to CM from control cells. C) Representative images (left panels) and relative quantification (right panel) of M-DM migration in response to CM from Mneo (CM Mneo), Mxl90 (CM Mxl90) or Mxl7 (CM Mxl7) cells. The quantification was performed by counting the number of migrated cells in at least 10 fields for each condition. The results are reported as percentage of migrated cells/field. p-values were calculated between the percentage of M-DM migrated in response to CM derived from Bcl-xL overexpressing cells, respect to the CM from control melanoma cells. A) The mean ± SEM and B,C) mean ± SD of three independent experiments is reported, *p < 0,05, **p < 0.01

A) Quantification of the protein array probed with CM from control (Mneo) or Bcl-xL overexpressing (Mxl90) melanoma cells. Fold expression of Mxl90 relative to Mneo cells is reported. B,D) qRT-PCR analysis of B) IL-8, IL-1β, IL-4 and TNFα and D) MCSF, CCL2 and CCL5 in Mneo, Mxl90 and Mxl7 cells. C) IL-8 and IL-1β protein secretion by ELISA in Mneo, Mxl90 and Mxl7 cells. E,F) CCL5 protein expression by E) Western blot analysis and F) ELISA in Mneo, Mxl90 and Mxl7 cells. HSP70 is shown as loading and transferring control. One representative western blot analysis out of two with similar results is reported. The numbers indicate densitometric analysis relative to control. B-F) The results represent the average ± SEM of three independent experiments, p-values were calculated between control and Bcl-xL overexpressing cells, *p < 0.05, **p < 0.01

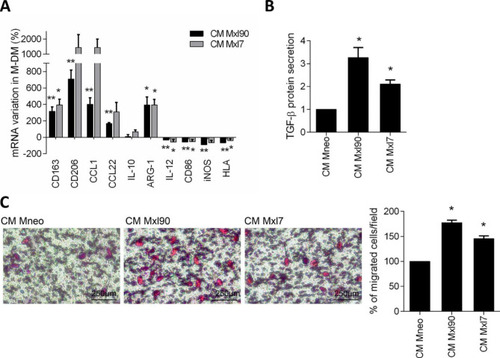
qRT-PCR analysis of CD163, CD206, CCL1, CCL22, IL-12, CD86, iNOS and HLA in M-DM stimulated for 24 h with CM from Bcl-xL overexpressing A) Mxl90 and B) Mxl7 melanoma cells with or without anti-IL-1β (ABIL-1β) or anti-IL-8 (ABIL-8) blocking antibodies. Percentage of mRNA variation relative to untreated cells is reported. p-values were calculated between Bcl-xL overexpressing cells untreated and treated with antibody. C) Representative images (left panels) and relative quantification (right panel) of M-DM migration in response to CM from control (CM Mneo), Mxl90 untreated (CM Mxl90) or treated with the blocking antibody CCL5 (CM Mxl90 + ABCCL5). The quantification was performed by counting the number of migrated cells in at least 10 fields for each condition. p-values were calculated between M-DM migrated cells exposed to CM derived from Bcl-xL overexpressing clones treated and untreated with antibody. D) Representative images of Mneo, Mxl90 and Mxl90 cells silenced for CCL5 (Mxl90 siCCL5) stained in green 5 days after injection in the yolk sac of 2 days post fertilization Tg(mfap4:Tomato) zebrafish larvae, and relative quantification of E) recruited macrophages, F) interaction between melanoma cells and macrophages counted as yellow spots (green arrows), and G) invasion score of melanoma cells. p-values were calculated between E, G) number of melanoma cells and macrophages recruited in the tail of zebrafish larvae silenced or not for CCL5, F) number of interaction between macrophages and melanoma cells silenced or not for CCL5. *p < 0.05, **p < 0.01. ***p < 0.001

A) qRT-PCR analysis and B) ELISA of IL-1β, IL-8 and CCL5 expression in control (Mneo) and Bcl-xL overexpressing melanoma cells transfected with IKBSR (Mxl90 IKBSR) or control (Mxl90) vectors. Fold induction relative to Mneo cells and the average ± SEM of three experiments is reported. The average ± SEM of three independent experiments is reported. C) Representative images (left panels) and relative quantification (right panel) of M-DM migration in response to CM from Mneo (CM Mneo), Mxl90 (CM Mxl90) and Mxl90 IKBSR (CM Mxl90 IKBSR) cells. The quantification was performed by counting the number of migrated cells in at least 10 fields for each condition. p-values were calculated between the percentage of migrated cells exposed to CM derived from Bcl-xL overexpressing clone transfected with CMV or IKBSR. D) Representative images of Mneo, Mxl90 and Mxl90 IKBSR cells (red arrows) 5 days after injection in the yolk sac of 2 days post fertilization Tg (mpeg1: EGFP) zebrafish larvae, and relative quantification of E) recruited macrophages (green arrows) and F) invasion score of melanoma cells invading the tail. *p < 0.05, **p < 0.01, ***p < 0.001

A) Representative images and B) relative quantification of invasion score of control (Mneo) and Bcl-xL overexpressing (Mxl90) melanoma cells (green arrows) 3 days after injection in the yolk sac of 2 days post fertlization of the mpeg1:GAL4FF, UAS:NTR-mCherry transgenic line expressing bacterial nitroreductase (NTR) fused to mCherry in macrophages, treated with DMSO or 10 mM Metronidazole (MTZ). ***p < 0.001; ns, non-significant

Acknowledgments
This image is the copyrighted work of the attributed author or publisher, and ZFIN has permission only to display this image to its users. Additional permissions should be obtained from the applicable author or publisher of the image. Full text @ J. Exp. Clin. Cancer Res.