
- Title
-
The influence of size and surface chemistry on the bioavailability, tissue distribution and toxicity of gold nanoparticles in zebrafish (Danio rerio)
- Authors
- Windell, D.L., Mourabit, S., Moger, J., Owen, S.F., Winter, M.J., Tyler, C.R.
- Source
- Full text @ Ecotoxicol. Environ. Saf.
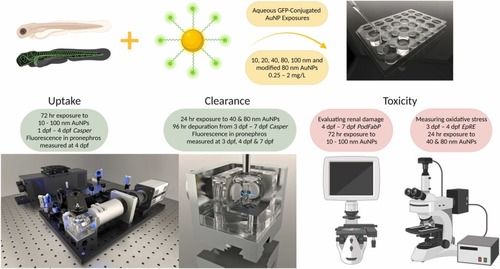
Diagrammatic representation of the studies conducted, experimental model used and endpoints measured. Experiments conducted; Uptake of AuNPs into 4 dpf Casper zebrafish embryo-larvae, Clearance of AuNP uptaken in 7 dpf Casper embryo-larvae and measurement of toxicity caused by exposure to AuNPs in zebrafish embryo-larvae using a PodFabP transgenic to evaluate renal damage and an electrophile response element (EpRE) transgenic to measure oxidative stress. |
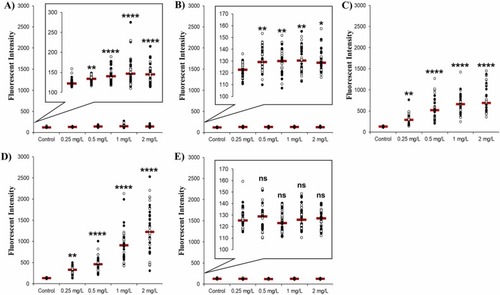
Uptake of different sized AuNPs into the pronephros of zebrafish measured by fluorescence detection with SPIM. Uptake was measured in both sides of the zebrafish pronephros (white markers – right side, black markers – left side). Fish were imaged using SPIM at 4 dpf after 72 h exposure to AuNPs of sizes (a) 10 nm, (b) 20 nm, (c) 40 nm, (d) 80 nm, and (e) 100 nm. Raw data are represented as a scatter plot with means shown (indicated by the red line) for three independent experiments n = 18. (****P < 0.0001, **P < 0.01, *P < 0.05 and ns = not significant). Magnified versions of the graph are provided as figure insets for the 10 nm, 20 nm and 100 nm AuNPs to best visualise the comparatively low levels of particle uptake/fluorescence for these exposures. |
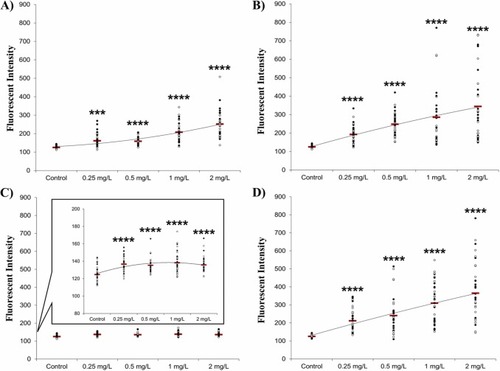
Uptake of 80 nm AuNPs with different modifications as measured in the pronephros of zebrafish embryo-larvae measured via fluorescence detection with SPIM. Uptake was measured in both sides of the zebrafish pronephros (white markers – right side, black markers – left side): Fish were imaged using SPIM at 4 dpf after 72 h exposure to AuNPs. (A) Unmodified 80 nm AuNPs (B) TNF modified 80 nm AuNP (C) NHS modified 80 nm AuNP (D) PEG modified 80 nm AuNP. Raw data are represented as a scatter plot with means (shown by the red line) for three independent experiments (Kruskal-Wallis test followed by a Dunn’s post hoc test; ****P < 0.0001). A magnified version of the graph is provided for the NHS modified AuNP to help best visualise the comparatively low levels of particle uptake/fluorescence for this exposure. |
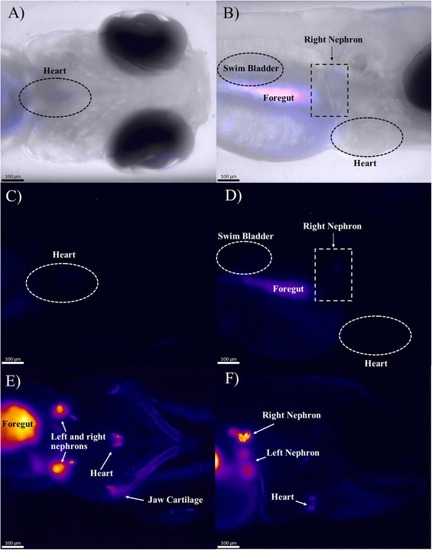
SPIM images of Casper zebrafish embryo-larvae at 20 ×. Non-exposed controls (A–D) and zebrafish embryo-larvae exposed to 2 mg/L 80 nm AuNPs (E–F). Brightfield imaging of the control provided a reference for specific organs with autofluorescence overlaid (A–B). The non-exposed, control embryo-larvae showed minimal fluorescence in both ventral and dorsal view (C & D respectively). The exposed embryo-larvae showed AuNP accumulation in the heart and the jaw cartilage (E). In the profile view (F), fluorescence can be seen in the jaw, in the right nephron and (blurred image) in the left nephron. Autofluorescence is visible in the gut (D) but the fluorescent signal is significantly higher in the AuNP exposed zebrafish (E & F). |

Confocal imaging of AuNP fluorescence in 4 dpf zebrafish embryo-larvae. (A) Max intensity z-stacks of a Casper embryo-larvae control using both SPIM (Ai) and confocal microscopy (Aii/Aiii) both indicating low levels of autofluorescence. The drawn white outline indicates the position of the pronephros. (B) Max intensity z-stacks of a Casper embryo-larvae exposed to 2 mg/L of 80 nm AuNPs for 72 hrs using SPIM with (Bi) and without brightfield (Bii) and confocal microscopy (Biii) indicating little difference in signal sensitivity between the two microscopic techniques. (C) AiryScan max intensity z-stacks of 4 dpf Casper embryo-larvae after exposure to 72 hr to PEG coated 80 nm AuNPs. (Ci) A stitched max intensity image of the embryo-larvae indicating fluorescence in the pronephros. (Cii) Pronephros in Casper control embryo-larvae showing background fluorescence. (Ciii) Uptake of PEG coated 80 nm AuNPs visualised in the pronephros. (D) A max intensity confocal Z stack of a Casper zebrafish embryo-larvae exposed to 2 mg/L 80 nm AuNPs for 72 h showing their presence in the pronephros (Di, 10 ×) and in the proximal straight tubule/proximal early segment of the pronephros (Dii, 20 ×). |

Clearance of 80 nm AuNPs (exposed at 2 mg/L) from the pronephros of zebrafish embryo-larvae measured by fluorescence detection with SPIM with the data presented as scatter plots. Fluorescence was measured in both sides of the zebrafish embryo-larvae pronephros and averaged for each individual fish. The same fish were recorded over the 72 hr depuration period. Fluorescence was measured at 3 dpf, after the 24 h exposure, and subsequently at two depuration time points (after a further 24 hr and 72 h): (A) TNF modified AuNP (B) PEG modified AuNP. Raw data are represented as individual fish with means shown (as red lines) for two independent experiments n = 12. (Friedman test, followed by a Dunnett’s post hoc test; ****P < 0.0001, ***P < 0.001 and **P < 0.01). |
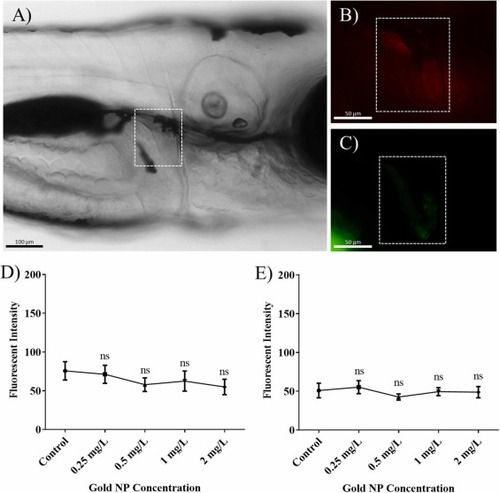
Oxidative stress indicated by mCherry fluorescence measured in 3EpRE:hsp70:mCherry zebrafish embryo-larvae after exposure to AuNPs for 24 h. The kidney outline is highlighted over the brightfield image (A) and over the red fluorescence (mCherry) detection image (B). The fluorescence signal from the AuNPs is faintly visible in (C). These Zeiss Inverted images are for EpRE zebrafish embryo-larvae exposed to 2 mg/L 80 nm AuNPs. Data for exposure to (D) 40 nm and (E) 80 nm AuNPs are represented as means ± SEM for two independent experiments n = 12. (Kruskal-Wallis test followed by a Dunn’s post hoc test; ns = not significant). |