FIGURE SUMMARY
Title

Circadian regulation of developmental synaptogenesis via the hypocretinergic system

Authors
Du, X.F., Li, F.N., Peng, X.L., Xu, B., Zhang, Y., Li, G., Liu, T., Li, Y., Wang, H., Yan, J., Du, J.L.
Source
Full text @ Nat. Commun.

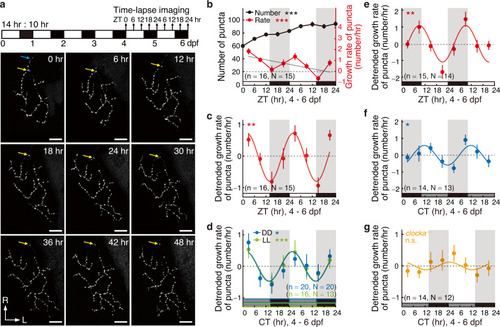
Circadian rhythm of retinotectal synaptogenesis during development in larval zebrafish in vivo.

a Top, experimental procedure diagram. PGUSG larvae were entrained to 14–10 light-dark (LD) cycles during 0–4 days post fertilization (dpf) and then imaged every 6 hrs for 2 days from light onset (ZT0) at 4 dpf. Bottom, images obtained with a 6 h interval of a typical RGC axon arbor expressing Sypb-EGFP in the right hemisphere of the optic tectum (OT). Blue arrow, the primary axon; yellow arrow, a punctum at the first branch point of the axon arbor. L, lateral; R, rostral. Scale bars: 10 µm. b Summary of the total number (black) and growth rate (red) of Sypb-EGFP puncta on single-RGC axon arbor during 4–6 dpf. The larvae were under LD during 0–6 dpf. Gray line, linear-fitting line on the mean value of growth rate data. c Detrended growth rate of puncta shown in (b, red). It was obtained by subtracting the linear-fitting line from each raw data. dg Detrended growth rate of puncta imaged during 4–6 dpf for wild type (WT) (df) or clocka−/− (g) larvae raised under different light conditions. d Blue and (g), LD during 0–4 dpf and constant darkness (DD) during 4–6 dpf; d Green, LD during 0–4 dpf and constant light (LL) during 4–6 dpf; e dark-light (DL) during 0–6 dpf; f DL during 0–4 dpf and DD during 4–6 dpf. Zebra stripes, day-night cycles; white stripe, daytime; gray stripe, subjective daytime; black stripe, nighttime or subjective nighttime. Colored curve, cosine-fitting waves. CT, circadian time; ZT, zeitgeber time. Numbers in brackets indicate the number of RGCs (n) and larvae (N) examined. n.s., not significant; ***P < 0.0001 in (b), **P = 0.001 in (c), *P = 0.01 and ***P = 0.0006 in (d), **P = 0.006 in (e), *P = 0.01 in (f) (one-way ANOVA for (b), one-tailed Fisher’s g-test for (cg)). Error bars denote s.e.m.. Source data are provided as a Source Data file.

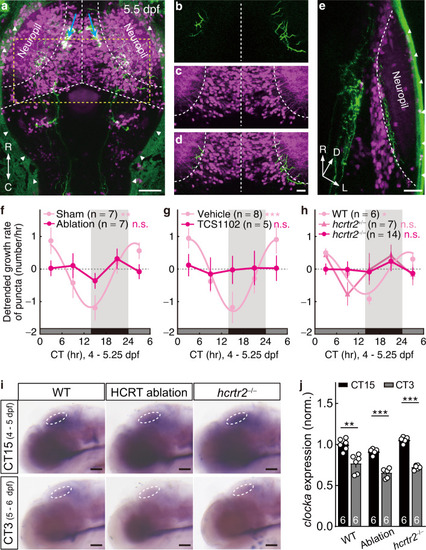
Hypocretinergic system is required for the circadian rhythm of synaptogenic rate.

ae Confocal images of the dorsal projection view (a), a cropped and partial (6-μm thick) projection view (bd), and the rotated (60° along y-axis) lateral 3-D projection view (e) of a 5.5-dpf Tg(−2.0Tru.Hcrt:EGFP)zf11;Mü4023 larva showing the location of HCRT neuron somas (a, blue arrows) and their axon projections (green, be). The Mü4023 labels some tectal neurons (TNs) in OT (magenta). Arrowheads, nonspecific fluorescent signals on the skin; white dotted line, borders of the OT and the boundaries between the neuropil and soma layer of the OT or between the two tectal hemispheres; yellow dotted line, the cropped area for (bd). Three independent experiments were repeated. fh Detrended growth rate of Sypb-EGFP puncta imaged during 4–5.25 dpf showing that the circadian rhythm of retinotectal synaptogenesis is disrupted by bilateral HCRT neuron ablation (f), HcrtR antagonist TCS1102 treatment (g), and hcrtr2 mutation (h). Larvae entrained with normal LD cycles during 0–4 dpf were then reared under DD. i Lateral view of whole mount in situ hybridization showing unaffected rhythmic clocka expression under DD conditions after 4-day LD entrainment in the OT of larvae with bilateral HCRT neuron ablation or hcrtr2 mutation. j Quantification of the clocka mRNA expression in OT at the two circadian time points shown in (i). For each individual, the mean signal intensity in the circled tectal area (white circle in i) was normalized to the mean value of the WT group at CT15. The numbers on the bars indicate the numbers of larvae examined. Scale bars, 50 μm (a, i), 20 μm (be). n.s., not significant; **P = 0.002 in (f), ***P = 8.0 × 10−4 in (g), *P = 0.01 in (h); **P = 0.001, ***PAblation = 2.0 × 10−6 and ***Phcrtr2-/- < 1.0 × 10−6 in (j) (one-tailed Fisher’s g-test for (fh), nonparametric two-tailed multi t-test with Holm-Sidak method for multiple comparisons correction for j). C caudal, D dorsal, L lateral, M medial, R rostral, CT circadian time. Error bars denotes s.e.m.. Source data are provided as a Source Data file.

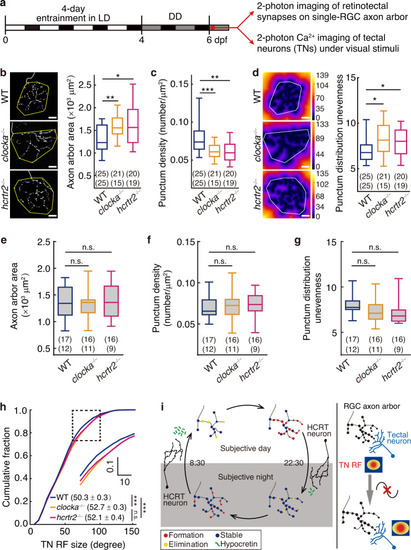
Circadian rhythm of synaptogenesis affects the arrangement of retinotectal synapses and the refinement of visual function.

a Experimental procedure diagram. Larvae reared under LD during 0–4 dpf and DD afterwards were assayed at 6 dpf. b Left, projection view of a typical RGC axon arbor expressing Sypb-EGFP in WT, clocka−/− or hcrtr2−/−. Right, boxplots of the arbor territory/area (yellow polygon) (**P = 0.006; *P = 0.02). c Boxplots of the punctum density of single-RGC axon arbor calculated by total punctum number dividing arbor territory (***P = 0.0006; **P = 0.001). d Left, heat maps of the images in (b) color-coded by the distance of each pixel to its nearest punctum. Right, boxplots of the standard deviation of pixel intensities within the arbor territory (white polygon) (P = 0.02). eg The same measurements as in (bd) but larvae were raised in DD from 0 dpf. h Cumulative distribution of the receptive field (RF) size of tectal neurons (TNs) in WT (5976 TNs, 12 larvae), clocka−/− (5416 TNs, 12 larvae) and hcrtr2−/− (4859 TNs, 10 larvae) (Pclocka-/-vs WT = 5.2 × 10−8; Phcrtr2-/-vs WT = 1.2 × 10−4). Inset, zoom-in view of the dashed black square. i Working model. Left, during brain development, endogenous circadian clock drives retinotectal synapses (made by RGC axons on TN dendrites) to grow faster at daytime and slower at nighttime, a process due to rhythmic synapse formation (red puncta) but not synapse elimination (yellow puncta). The HCRT neural system is involved in this circadian retinotectal synaptogenesis rhythm. Right, disruption of the circadian synaptogenesis rhythm causes defects in the development of retinotectal synapses, RGC axon arbors and TN function. Scale bars, 10 μm. Numbers in brackets indicate the numbers of RGCs (top) and fish (bottom) examined. The same datasets were used in (bd) or in (eg). n.s., not significant; *P < 0.05, **P < 0.01, ***P < 0.001 (nonparametric two-tailed Mann–Whitney test in (bg); one-tailed two-sample Kolmogorov-Smirnov test in (h)). Boxplots in (bg): centre, median; bounds of box, first and third quartiles; whiskers, minimum and maximum values. Source data are provided as a Source Data file.

Acknowledgments
This image is the copyrighted work of the attributed author or publisher, and ZFIN has permission only to display this image to its users. Additional permissions should be obtained from the applicable author or publisher of the image. Full text @ Nat. Commun.