
- Title
-
Phosphorylation of α-synuclein at T64 results in distinct oligomers and exerts toxicity in models of Parkinson's disease
- Authors
- Matsui, H., Ito, S., Matsui, H., Ito, J., Gabdulkhaev, R., Hirose, M., Yamanaka, T., Koyama, A., Kato, T., Tanaka, M., Uemura, N., Matsui, N., Hirokawa, S., Yoshihama, M., Shimozawa, A., Kubo, S.I., Iwasaki, K., Hasegawa, M., Takahashi, R., Hirai, K., Kakita, A., Onodera, O.
- Source
- Full text @ Proc. Natl. Acad. Sci. USA

Identification of a novel phosphorylation site of human α-synuclein at T64. (A) α-synuclein of N. furzeri or O. latipes brains were immunoprecipitated and subjected to liquid chromatography–tandem mass spectrometry. The figure indicates phosphorylation sites identified in N. furzeri α-synuclein or O. latipes α-synuclein through tolerant screening. Identified residues are indicated by bold red characters. Please also refer SI Appendix, Table S1. (B) α-synuclein of human brains (nucleus basalis of Meynert) were immunoprecipitated and subjected to liquid chromatography–tandem mass spectrometry. The figure indicates comparison of the phosphorylation sites identified in human, N. furzeri and medaka α-synuclein through tolerant screening. Red squares show the specific phosphorylation site of N. furzeri α-synuclein, blue squares show the T64 phosphorylation site of human α-synuclein, and green squares show mutation sites in human familial PD. Patients’ profiles are described in SI Appendix, Table S3. Please also refer SI Appendix, Table S1. (C) Validation of phosphorylated N. furzeri α-synuclein antibodies using CIP treatment or α-synuclein KO samples. CIP+: N. furzeri Brain lysates with CIP treatment. CIP-: N. furzeri Brain lysates without CIP treatment. WT: Brain lysates of wild-type N. furzeri. KO: Brain lysates of α-synuclein KO N. furzeri. (D) Dot blotting analysis showed a highly specific reaction of anti-human T64-P α-synuclein antibody. Each synthetic peptide corresponding to the amino acids of human α-synuclein T33-P, T44-P, T54-P, T64 and T64-P was applied to a hydrophilized PVDF membrane. (E) The western blotting shows the analysis of N. furzeri brains (TBS-insoluble SDS-soluble fraction) at 1 and 5 mo using anti-S60-P N. furzeri α-synuclein. The red arrow indicated S60 phosphorylation. The graph shows quantitative analysis of S60 phosphorylation in SDS-soluble fraction using N = 4 samples/group. *P = 0.0358. (F) The western blotting shows the analysis of human PD brains (amygdala, TBS-insoluble SDS-soluble fraction) using anti-T64-P human α-synuclein. The red arrow indicated T64 phosphorylation. C: control, PD: Parkinson’s disease. The graph shows quantitative analysis of T64 phosphorylation in SDS-soluble fraction using N = 4 samples/group. *P = 0.0452. Patients’ profiles are described in SI Appendix, Table S3. |
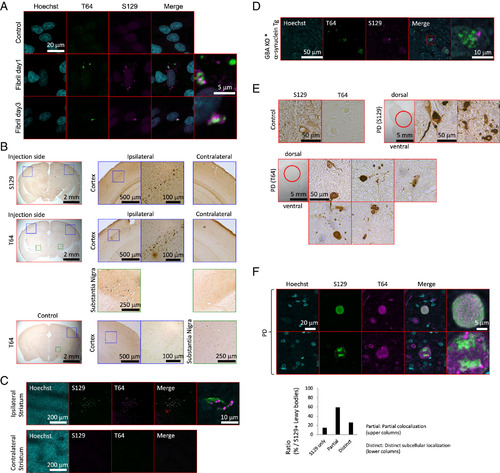
Distinct pathology of T64-phosphorylated α-synuclein. (A) T64-P and S129-P α-synuclein immunofluorescence of the SH-SY5Y cells transfected with α-synuclein fibrils. α-Synuclein Aggregation Assay Kit was used for the transfection of α-synuclein fibrils and cells are subjected to immunofluorescence at 1 and 3 d after transfection. (B) Immunohistochemistry of T64-P and S129-P α-synuclein in the mouse PD models (α-synuclein PFF mouse). α-Synuclein fibrils were injected into the striatum of C57BL/6J mice at 5 mo. Two months after inoculation, the mice were sacrificed and the brains were subjected to immunohistochemistry. (C) Immunofluorescence of T64-P and S129-P α-synuclein in the mouse PD models (α-synuclein PFF mouse). α-Synuclein fibrils were injected into the striatum of C57BL/6J mice at 5 mo. Two months after inoculation, the mice were killed, and the brains were subjected to immunofluorescence. (D) Immunofluorescence of T64-P and S129-P α-synuclein in the zebrafish PD models. Zebrafish (Tg(XenopusNBT:human α-synuclein);gba-/-) were killed and subjected to immunofluorescence at 3 mo of age. (E) Immunohistochemistry of T64-P and S129-P α-synuclein in the human PD brains. The medulla oblongata sections of human postmortem brains were used for immunohistochemistry. Patient profiles are described in SI Appendix, Table S3. (F) Immunofluorescence of T64-P and S129-P α-synuclein in the human PD brains. The medulla oblongata sections of human postmortem brains were used for immunofluorescence. Patient profiles are described in SI Appendix, Table S3. |

Oligomer structure of T64-phosphorylated α-synuclein. (A) BN-PAGE and Western blotting of T64-P α-synuclein in the SH-SY5Y cells transfected with α-synuclein fibrils or the human PD brains. α-Synuclein Aggregation Assay Kit was used for the transfection of α-synuclein fibrils and cells are used at 2 d after transfection. TBS-soluble or TBS-insoluble SDS-soluble fractions of the SH-SY5Y cells and human brains were used for BN-PAGE and Western blotting. (B) BN-PAGE and CBB staining analysis of purified α-synuclein oligomers in the WT and T64D phosphomimetic mutant. Each purified α-synuclein (WT or T64D) was incubated for 8 h at 4 °C without agitation and then subjected to ultracentrifugation. The supernatants were subjected to multiple filtration steps to purify α-synuclein oligomers. (C) Two-dimensional electromicroscopic analysis of purified α-synuclein oligomers in the WT, T64A mutant, T64D phosphomimetic mutant and A53T mutant. All particles used for 2D classification were divided into oligomers, particles of lengths of 60 Å or less, and particles with a class distribution of 1% or less, and the number of particles and percentages are plotted in the pie chart. Original electromicroscopic images are shown in SI Appendix, Fig. S5E. (D) Realtime quaking-induced conversion (RT-QuIC) of WT (green) and T64D (red) α-synuclein. RFU: Relative Fluorescence Unit. N = 3 samples/group. |
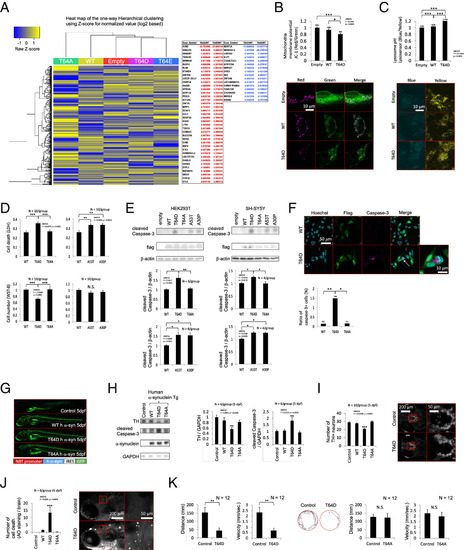
Cytotoxicity and death of dopaminergic neurons induced by α-synuclein phosphorylation at T64. (A) RNA sequence analysis of the SH-SY5Y cells transfected with WT, T64A, T64D, or T64E α-synuclein. RNA was isolated 7 d after electroporation. The mRNAs with a more than twofold increase (red) or decrease (blue) in both the T64D and T64E samples are listed. (B) Mitochondrial membrane potential in the SH-SY5Y cells transfected with WT or T64D α-synuclein. Mitochondrial membrane potential was measured 5 d after electroporation using a JC-1 MitoMP Detection Kit. The numbers on the bar graph indicate the total cell number analyzed. *P = 0.0150, ***P < 0.0001. (C) Lysosomal pH in the SH-SY5Y cells transfected with WT or T64D α-synuclein. Lysosomal pH was evaluated 5 d after electroporation using LysoSensor Yellow/Blue DND-160 (PDMPO). The numbers on the bar graph indicate the total cell number analyzed. ***P < 0.0001. (D) Cell death or viability in the HEK293T cells transfected with WT, T64D, T64A, A53T, or A30P α-synuclein. Cell death was measured by LDH Cytotoxicity Detection Kit 4 d after plasmid transfection using Lipofectamine 3000 reagent. Cell viability was measured by Cell Counting Kit-8 4 d after plasmid transfection using Lipofectamine 3000 reagent. N = 10 samples/group. Cell death: WT vs. T64D: P < 0.0001, T64A vs. T64D: P = 0.0002, WT vs. A30P: P = 0.0012, WT vs. A53T: P = 0.0016. Cell viability: WT vs. T64D: P < 0.0001, T64A vs. T64D: P < 0.0001. N.S.: not significant. (E) Western blotting of cleaved Caspase-3 in the HEK293T or SH-SY5Y cells transfected with WT, T64D, T64A, A53T or A30P α-synuclein. HEK293T cells were collected 4 d after plasmid transfection using Lipofectamine 3000 and SH-SY5Y cells were collected 5 d after electroporation. The graphs show quantitative analysis of cleaved Caspase-3 using N = 6 (HEK293T) or 4 (SH-SY5Y) samples/group. HEK293T: WT vs. T64D: P = 0.0015, T64A vs. T64D: P = 0.003, WT vs. A30P: P = 0.0052, WT vs. A53T: P = 0.0038. For the ANOVA comparison among T64D, A53T and A30P, the F value = 0.0508 and P = 0.9506 (N.S.). SH-SY5Y: WT vs. T64D: P = 0.0145, T64A vs. T64D: P = 0.0099, WT vs. A30P: P = 0.0057, WT vs. A53T: P = 0.0039. For the ANOVA comparison among T64D, A53T and A30P, the F value = 0.0364 and P = 0.9644 (N.S.). N.S.: not significant. (F) Caspase-3-positive SH-SY5Y cells (white arrow) transfected with T64D α-synuclein. SH-SY5Y cells were subjected to immunofluorescence 5 d after electroporation. The graph shows the percentage of caspase-3-positive SH-SY5Y cells transfected with WT, T64A or T64D α-synuclein. The numbers on the bar graph indicate the total cell number counted. *P = 0.0043, **P = 0.0027. (G) Images of Zebrafish: Control fish, Tg(NBT:human α-synuclein WT IRES GFP)Tg(NBT:human α-synuclein T64D IRES GFP) and Tg(NBT:human α-synuclein T64A IRES GFP) at 5 dpf. (H) Western blotting of TH, Caspase-3 and α-synuclein in zebrafish: Control fish, Tg(NBT:human α-synuclein WT IRES GFP)Tg(NBT:human α-synuclein T64D IRES GFP) and Tg(NBT:human α-synuclein T64A IRES GFP) at 5 dpf. The graphs show quantitative analysis of TH and Caspase-3 using N = 6 fishes/group. Dunnett's test was applied (Control = Control fish). **P = 0.0038 (TH), **P = 0.0067 (cleaved Caspase-3). (I) Dopaminergic neurons in zebrafish: Control fish, Tg(NBT:human α-synuclein WT IRES GFP)Tg(NBT:human α-synuclein T64D IRES GFP) and Tg(NBT:human α-synuclein T64A IRES GFP) at 5 dpf. The graph shows the number of DC2 and DC4 dopaminergic neurons of the posterior tuberculum. N = 10 fishes/group. Dunnett's test was applied (Control = Control fish). ***P < 0.0001. (J) Cell death in zebrafish brain: Control fish, Tg(NBT:human α-synuclein WT IRES GFP)Tg(NBT:human α-synuclein T64D IRES GFP) and Tg(NBT:human α-synuclein T64A IRES GFP) at 5 dpf. Cell death was analysed using Acridine Orange Staining. N = 8 fishes/group. Dunnett's test was applied (Control = Control fish). ***P = 0.0002. (K) Spontaneous swimming movement in zebrafish. Control fish and Tg(NBT:human α-synuclein T64D IRES GFP) at 5 dpf. N = 12 fishes/group. **P = 0.0071 (Distance), P = 0.0070 (Velocity). Control fish and Tg(NBT:human α-synuclein T64A IRES GFP) at 5 dpf. N = 12 fishes/group. N.S.: not significant. Tracking shows a representative trace of the zebrafish movements for 1 min. |