FIGURE SUMMARY
Title

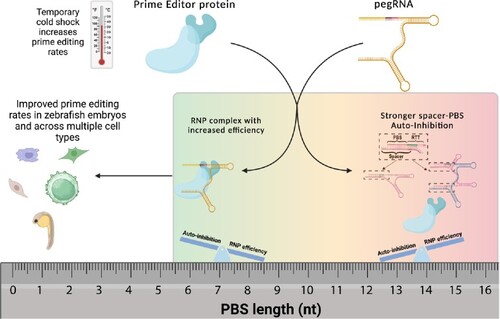
Reducing the inherent auto-inhibitory interaction within the pegRNA enhances prime editing efficiency

Authors
Ponnienselvan, K., Liu, P., Nyalile, T., Oikemus, S., Maitland, S.A., Lawson, N.D., Luban, J., Wolfe, S.A.
Source
Full text @ Nucleic Acids Res.

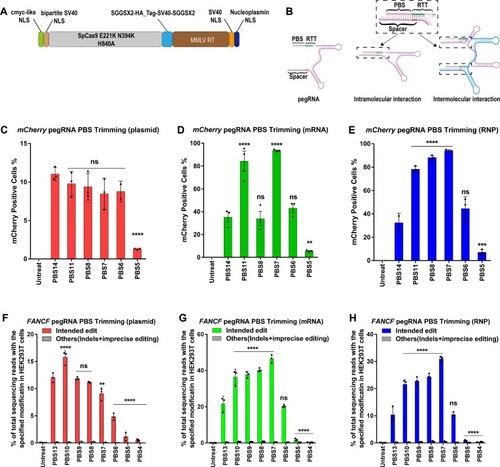
PE2 editing efficiency as a function of pegRNA PBS length at three genomic sites in HEK293T cells using three different delivery platforms. (A) Architecture of the PEmax protein expression construct. (B) The PBS and spacer sequence within the pegRNA are complementary to each other and can potentially form intramolecular and intermolecular interactions through Watson–Crick base pairing. The complementarity can extend into the first 3 nt of the RTT region if it is identical to the DNA target site (this region is highlighted in the spacer sequence in red). (C–E) Conversion of a stop codon (TAG) to glutamine (CAG) by prime editing to restore function to a mCherry reporter in HEK293T cells (4). Frequencies of mCherry positive cells were quantified by flow cytometry 72 h following treatment. (C) 200 ng PEmax plasmid and 100 ng pegRNA plasmid were used for transient transfection; (D) 1 μg PEmax mRNA and 100 pmol pegRNA were used for mRNA nucleofection; and (E) 50 pmol PEmax protein and 200 pmol pegRNA were used for RNP nucleofection. One-way ANOVA was used to compare all the groups for each graph, PBS14 was used as a control column for multiple comparisons. ns indicates P > 0.05, ** indicates P ≤ 0.01, *** indicates P ≤ 0.001 and **** indicates P ≤ 0.0001 (also see Supplementary table). (F–G) PE-specified intended substitution (G•C to T•A transversion) at the +5 position of FA Complementation Group F (FANCF) site or other editing outcomes (indels and imprecise prime editing is combined). (F) 200 ng PEmax plasmid and 100 ng pegRNA plasmid were used for transient transfection; (G) 1 μg PEmax mRNA and 100 pmol pegRNA were used for mRNA nucleofection; and (H) 50 pmol PEmax protein and 200 pmol pegRNA (from IDT) were used for RNP electroporation. Cells were harvested 72 h following treatment. One-way ANOVA was used to compare the intended edit across all the groups for each graph, PBS13 was used as a control column for multiple comparisons. ns indicates P > 0.05, ** indicates P ≤ 0.01, and **** indicates P ≤ 0.0001 (also see Supplementary table).

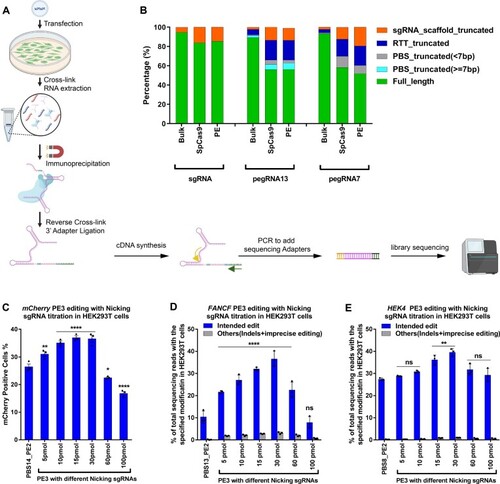
Small RNA-seq analysis of different pegRNA species bound to the Prime editor in HEK293T cells. (A) Schematic for the small RNA-seq library preparation. Briefly, HEK293T cells were transfected with plasmids encoding one of two effectors (SpCas9 or PEmax), and one guide RNA (sgRNA, pegRNA or epegRNA). Cells were harvested after 2 days, crosslinked and then lysed for total RNA isolation. To sequence the bound pegRNA or epegRNA population, the SpCas9 or PEmax protein (containing 3xHA-tag) was immunoprecipitated then crosslinking was reversed to purify the bound RNA. This was followed by 3’ DNA adapter ligation (3’ adapter contains 15 bp UMI sequence) to the purified RNA, cDNA synthesis and two rounds of PCR to add sequencing adapters. The final library was deep sequenced and analyzed. A detailed protocol is present in the methods section. (B) Bulk or effector-bound RNA species present from each treatment group. ‘Bulk’ indicates sequencing of the sgRNA/pegRNA present in the cell without IP pulldown to examine the sgRNA/pegRNA 3’ sequence lengths irrespective of whether it is bound to SpCas9 or PEmax. The length of the PBS in the pegRNA (7 or 13 nt) is indicated in the name. Small RNAs were categorized into six species based on the length of 3’ truncation: full-length pegRNA, pegRNA with truncated but potentially functional PBS (≥7 nt remaining), pegRNA with truncated likely insufficient PBS (<7 nt), pegRNA with truncated RTT, and pegRNA with truncated sgRNA scaffold. Abundance of each RNA species was calculated based on UMIs incorporated into the 3’ adaptor from the small RNA-seq library (see Supplementary Figure S7 for IGV plots). (C) RNP-mediated PE3 editing efficiencies in mCherry reporter cell line with different ratio of pegRNA:nicking sgRNA. The amount of PEmax protein (50 pmol) and pegRNA (200 pmol; IDT) was held constant while increasing the amount of nicking sgRNA (IDT) delivered by electroporation. Frequency of mCherry positive cells was quantified by flow cytometry 72 h following treatment. One-way ANOVA was used to compare all the groups for each graph, PE2 was used as a control column for multiple comparisons. ns stands for P > 0.05, * indicates P ≤ 0.05,** indicates P ≤ 0.01, and **** indicates P ≤ 0.0001 (also see Supplementary table). (D, E) RNP-mediated PE3 editing efficiencies at the specified positions for (D) FANCF (+5 G to T) and (E) HEK4 (+5 G to T) loci in HEK293T cells. The amount of PEmax protein (50 pmol) and pegRNA (200 pmol; IDT) was held constant while increasing the amount of nicking sgRNA (from IDT) delivered by electroporation. Editing efficiency reflects the frequency of sequencing reads from amplicon deep sequencing that contain the intended edit or others (indels and imprecise prime editing) among all sequencing reads. Values and error bars reflect mean ± s.d. of n = 3 independent biological replicates. One-way ANOVA was used to compare the intended edit across all the groups for each graph, PE2 was used as a control column for multiple comparisons. ns indicates P > 0.05, * indicates P ≤ 0.05,** indicates P ≤ 0.01, and **** indicates P ≤ 0.0001 (also see Supplementary table).

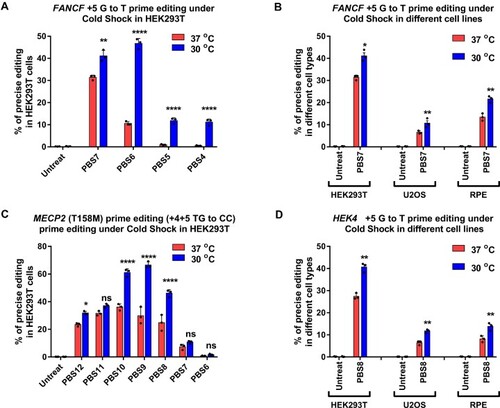
Cold shock enhances Prime editing rates in human cells. (A, C) RNP-mediated PE2 editing efficiency at the specified positions with varying pegRNA PBS length for (A) FANCF (+5 G to T) and (C) MECP2 (+4+5 TG to CC) loci in HEK293T cells. (B, D) RNP-mediated PE2 editing efficiency at the specified positions for (B) FANCF (+5 G to T) and (D) HEK4 (+5 G to T) loci in different cell lines (HEK293T, U2OS, RPE-1). 50 pmol PEmax protein and 100 pmol pegRNA were used for electroporation. Immediately after nucleofection, cells were incubated 3 days at 37°C or for cold shock, 12–16 h at 30°C followed by 2 days at 37°C. Editing efficiency reflects the frequency of sequencing reads that contain the intended precise edit among all amplicon deep sequencing reads. ‘Untreat’ indicates untreated cells. Values and error bars reflect mean ± s.d. of n = 3 independent biological replicates. Two-way ANOVA statistical analysis was used to determine the significance of prime editing at different temperature in different cell lines, ns indicates P > 0.05, ** indicates P ≤ 0.01, and **** indicates P ≤ 0.0001 (also see Supplementary table).

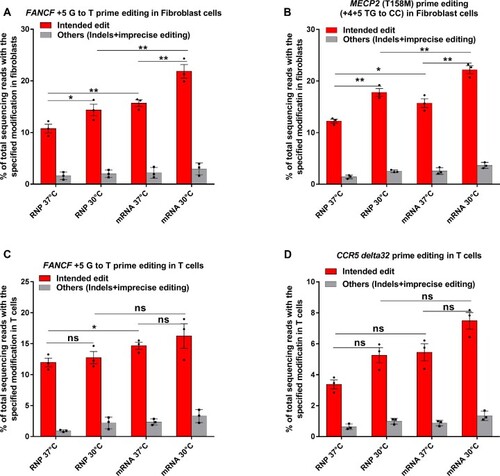
Prime editing efficiency in primary Fibroblasts and Primary T cells. (A, B) RNP and mRNA-mediated PE3 editing efficiencies at the specified positions for (A) FANCF (+5 G to T) and (B) MECP2 (+4+5 TG to CC) in fibroblast cells at 30°C and 37°C. Editing efficiencies reflect the frequency of sequencing reads that contain the intended precise edit or others (indels and imprecise prime editing) among all sequencing reads. Bars and error bars represent mean ± s.d. (n = 3 biologically independent replicates). (CD) RNP and mRNA-mediated PE3 editing efficiencies at the specified positions for FANCF (+5 G to T) and CCR5 (+4+5 TG to CC) in Primary T cells at 30°C and 37°C. Editing efficiency reflects the frequencies of sequencing reads that contain the intended precise edit and others (indels and imprecise prime editing) among all sequencing reads. Bars and error bars represent mean ± s.d. (n = 3 biologically independent replicates). One-way ANOVA statistical analysis was used to determine the significance of precise prime editing at different temperatures, ns indicates P > 0.05, * indicates P ≤ 0.05, and ** indicates P ≤ 0.01 (also see Supplementary table).

Acknowledgments
This image is the copyrighted work of the attributed author or publisher, and ZFIN has permission only to display this image to its users. Additional permissions should be obtained from the applicable author or publisher of the image. Full text @ Nucleic Acids Res.