IMAGE

Figure 2.

ID
ZDB-IMAGE-230724-27
Source
Figures for Ponnienselvan et al., 2023
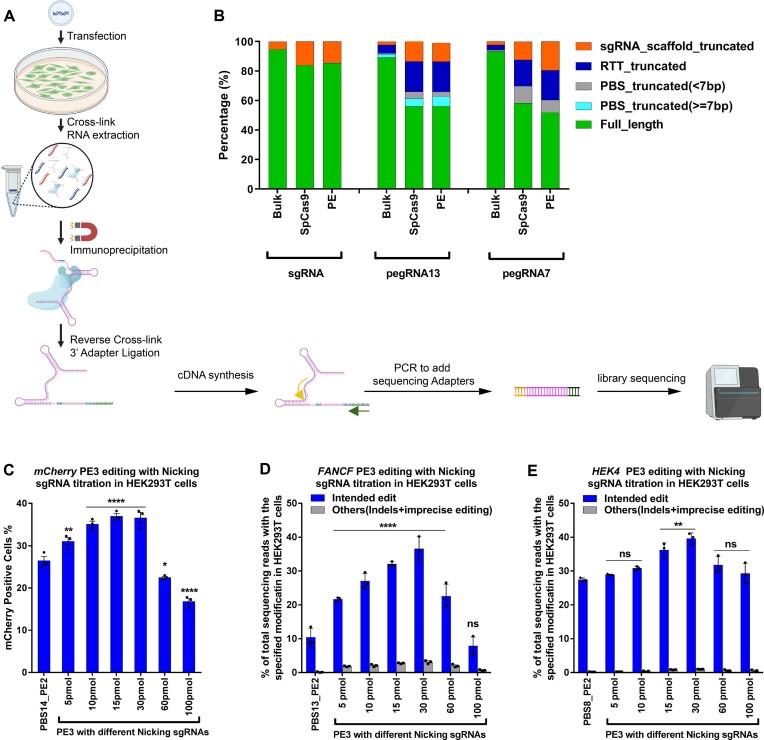
Image
Figure Caption

Figure 2.

Small RNA-seq analysis of different pegRNA species bound to the Prime editor in HEK293T cells. (A) Schematic for the small RNA-seq library preparation. Briefly, HEK293T cells were transfected with plasmids encoding one of two effectors (SpCas9 or PEmax), and one guide RNA (sgRNA, pegRNA or epegRNA). Cells were harvested after 2 days, crosslinked and then lysed for total RNA isolation. To sequence the bound pegRNA or epegRNA population, the SpCas9 or PEmax protein (containing 3xHA-tag) was immunoprecipitated then crosslinking was reversed to purify the bound RNA. This was followed by 3’ DNA adapter ligation (3’ adapter contains 15 bp UMI sequence) to the purified RNA, cDNA synthesis and two rounds of PCR to add sequencing adapters. The final library was deep sequenced and analyzed. A detailed protocol is present in the methods section. (B) Bulk or effector-bound RNA species present from each treatment group. ‘Bulk’ indicates sequencing of the sgRNA/pegRNA present in the cell without IP pulldown to examine the sgRNA/pegRNA 3’ sequence lengths irrespective of whether it is bound to SpCas9 or PEmax. The length of the PBS in the pegRNA (7 or 13 nt) is indicated in the name. Small RNAs were categorized into six species based on the length of 3’ truncation: full-length pegRNA, pegRNA with truncated but potentially functional PBS (≥7 nt remaining), pegRNA with truncated likely insufficient PBS (<7 nt), pegRNA with truncated RTT, and pegRNA with truncated sgRNA scaffold. Abundance of each RNA species was calculated based on UMIs incorporated into the 3’ adaptor from the small RNA-seq library (see Supplementary Figure S7 for IGV plots). (C) RNP-mediated PE3 editing efficiencies in mCherry reporter cell line with different ratio of pegRNA:nicking sgRNA. The amount of PEmax protein (50 pmol) and pegRNA (200 pmol; IDT) was held constant while increasing the amount of nicking sgRNA (IDT) delivered by electroporation. Frequency of mCherry positive cells was quantified by flow cytometry 72 h following treatment. One-way ANOVA was used to compare all the groups for each graph, PE2 was used as a control column for multiple comparisons. ns stands for P > 0.05, * indicates P ≤ 0.05,** indicates P ≤ 0.01, and **** indicates P ≤ 0.0001 (also see Supplementary table). (D, E) RNP-mediated PE3 editing efficiencies at the specified positions for (D) FANCF (+5 G to T) and (E) HEK4 (+5 G to T) loci in HEK293T cells. The amount of PEmax protein (50 pmol) and pegRNA (200 pmol; IDT) was held constant while increasing the amount of nicking sgRNA (from IDT) delivered by electroporation. Editing efficiency reflects the frequency of sequencing reads from amplicon deep sequencing that contain the intended edit or others (indels and imprecise prime editing) among all sequencing reads. Values and error bars reflect mean ± s.d. of n = 3 independent biological replicates. One-way ANOVA was used to compare the intended edit across all the groups for each graph, PE2 was used as a control column for multiple comparisons. ns indicates P > 0.05, * indicates P ≤ 0.05,** indicates P ≤ 0.01, and **** indicates P ≤ 0.0001 (also see Supplementary table).

Acknowledgments
This image is the copyrighted work of the attributed author or publisher, and ZFIN has permission only to display this image to its users. Additional permissions should be obtained from the applicable author or publisher of the image. Full text @ Nucleic Acids Res.