
- Title
-
phox2ba: The Potential Genetic Link behind the Overlap in the Symptomatology between CHARGE and Central Congenital Hypoventilation Syndromes
- Authors
- MacLean, J.E., Wertman, J.N., Prykhozhij, S.V., Chedrawe, E., Langley, S., Steele, S.L., Ban, K., Blake, K., Berman, J.N.
- Source
- Full text @ Genes (Basel)

ZFIN is incorporating published figure images and captions as part of an ongoing project. Figures from some publications have not yet been curated, or are not available for display because of copyright restrictions. EXPRESSION / LABELING:
|
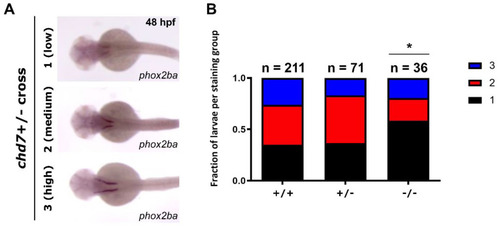
phox2ba expression is reduced in chd7 mutants compared to sibling embryos. (A) Representative images of chd7+/− cross embryos stained for phox2ba at 48 h post−fertilization (hpf) with scored phenotypes. Note that there are variable levels of expression ranging from “low” = 1, “medium” = 2, and “high” = 3. (B) Phenotype fractions bar graph of phox2ba staining in (A). Staining patterns were quantified by scoring based on intensity. The numbers of embryos scored for each genotype are indicated above the graphs. Note the increased proportion of embryos with weak staining patterns in the chd7−/− group. (Chi-square p = 0.0363 (indicated by ‘*’ above the mutant bar). |
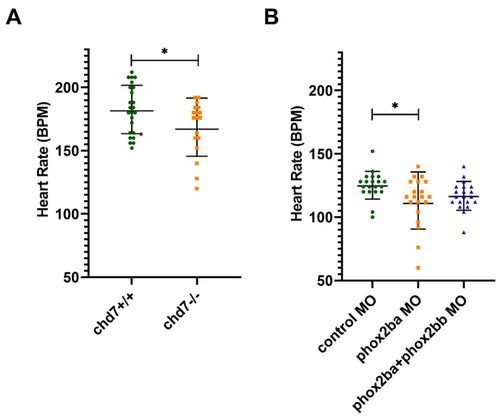
chd7−/− and phox2ba morpholino (MO) −injected larvae have lower heart rates than their WT or uninjected counterparts. (A) Heart rates were counted in zebrafish larvae under anesthesia at 72 h post−fertilization (hpf). * p ≤ 0.05, as per the two-tailed unpaired t−test, error bars represent SD, and each point represents an individual larva, green represents chd7+/+, orange represents chd7+/+ (+/+ n = 24, −/− n = 18). (B) Zebrafish Casper embryos were injected with morpholinos (MOs) at the one−cell stage to knock down RNA expression, and heart rates were counted under anesthesia at 72 hpf. Embryos injected with phox2ba MO had significantly lower heart rates than control MO−injected fish. * p < 0.05, as per one−way ANOVA with a Tukey post−test, error bars represent SD, each point represents an individual larva, green represents control MO, orange represents phox2ba MO, blue represents phox2bb MO n ≥ 9 larvae/group. PHENOTYPE:
|
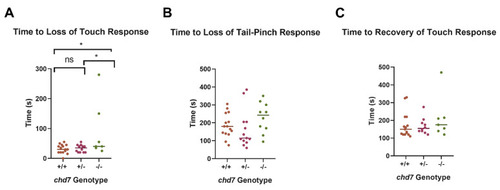
chd7−/− fish take longer to lose touch response under anesthetic. Anesthesia was assessed by the time it took adult zebrafish (previously genotyped as chd7+/+ [brown], chd7+/− [purple] or chd7−/− [green]) to lose their response to touch (A) and response to tail−pinch (B). Recovery was measured as the time it took the fish to regain the touch response (C). * p < 0.05, as per one−way ANOVA, with a Tukey post−test. PHENOTYPE:
|

chd7−/− fish have higher respiratory rates under anesthesia than their chd7+/+ counterparts. Adult fish were anesthetized, and respiratory rates (opercular movements) were recorded at the time fish lost their response to touch (time point 1− post loss of touch response) and response to fin−pinch (time point 2− post loss of fin pinch response). Fish were then moved to a recovery tank, and respiratory rates were assessed both upon entering the recovery tank (time point 3− initial recovery tank) and just before the fish recovered the ability to swim (time point 4–10 s prior to recovery). * p < 0.05, as per one-way ANOVA, with a Tukey post-test. Error bars represent standard deviation (SD). n = 7 for chd7−/− and n = 13 for the other two groups. PHENOTYPE:
|