
- Title
-
Esrrγa regulates nephron and ciliary development by controlling prostaglandin synthesis
- Authors
- Wesselman, H.M., Flores-Mireles, A.L., Bauer, A., Pei, L., Wingert, R.A.
- Source
- Full text @ Development
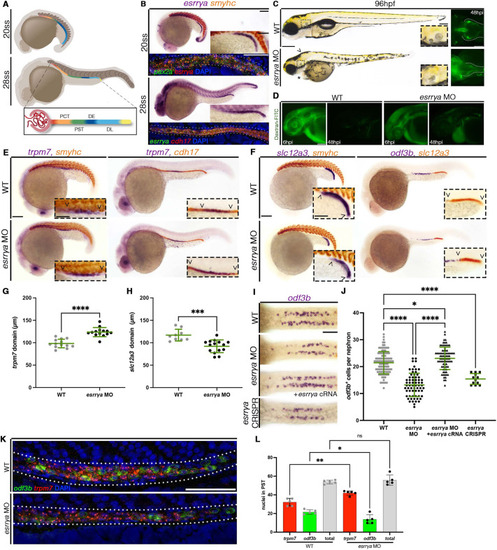
esrrγa is essential for nephrogenesis. (A) Zebrafish nephron development from 20-28 ss. Nephrons possess proximal convoluted tubule (PCT), proximal straight tubule (PST), distal early (DE) and distal late (DL) segments. (B) WISH and FISH reveal that esrrγa transcripts colocalize with renal progenitor marker pax2a at 20 ss. Somites marked with smyhc (red). At 28 ss, esrrγa colocalizes with tubule marker cdh17. (C) esrrγa morphants display pericardial edema (asterisk), smaller eyes and altered head morphology (arrowhead) and fused otoliths (inset) (left). Dextran-FITC in the PCT at 48 hpi, white dotted line outlines nephron (right). (D) WT and esrrγa SB morphant at 6 hpi and 48 hpi after dextran-FITC. (E,F) WISH for PST marker trpm7 (E) and DL marker slc12a3 (F) with somite marker smyhc or nephron marker cdh17. (G,H) Length of PST (G) and DL (H) at 28 ss, each dot represents a single animal. (I) WISH for MCC marker odf3b at 24 hpf. (J) MCCs per nephron; each dot represents one nephron. Two nephrons were counted per animal. (K) FISH for MCCs (odf3b, green and dashed ovals), PST cells (trpm7, red) and DNA (DAPI, blue) at 24 hpf. (L) Absolute cell number of odf3b- and trpm7-expressing cells at 24 hpf. Each dot represents a single animal. Data are mean±s.d. *P<0.05, **P<0.01, ***P<0.001, ****P<0.0001 (unpaired t-test or one-way ANOVA). ns, not significant. Scale bars: 100 µm (B-F); 50 µm (B,C,E,F insets, I,K). |
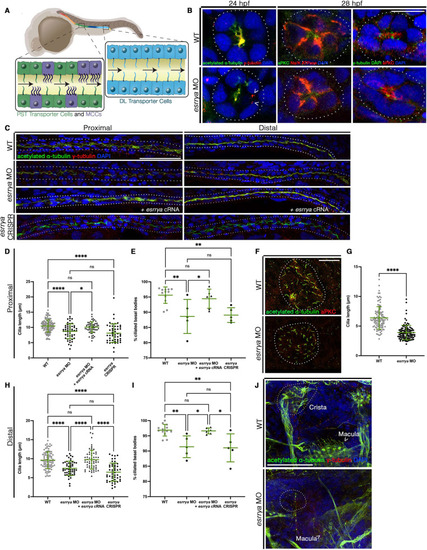
esrrγa is essential for ciliogenesis. (A) Multiciliated cells (MCCs) and monociliated transporter cells in the proximal straight tubule (PST) and distal late (DL). (B,C) IF for indicated markers. Dotted lines indicate the nephron. (D,H) Cilia length. Each dot represents one cilium, and ten cilia were measured per animal. WT n=12, esrrγa MO n=5, esrrγa MO with cRNA n=6, esrrγa crispant n=5. (E,I) Percentage of ciliated basal bodies. Each dot represents one animal. WT n=12, esrrγa MO n=5, esrrγa MO with cRNA n=6, esrrγa crispant n=5. (F) IF for indicated markers in Kupffer's vesicle (KV; outlined with dotted line) at the 10 ss. (G) KV cilia length. Each dot represents a single cilium. WT n=7, esrrγa MO n=7. (J) IF for indicated markers in ear at 4 dpf. Arrowhead denotes macula cilia, dotted line surrounds cristae structures. Data are mean±s.d.. *P<0.05, **P<0.01, ****P<0.0001 (unpaired t-test or one-way ANOVA). ns, not significant. Scale bars: 10 µm (B); 25 µm (F); 50 µm (C,J). |
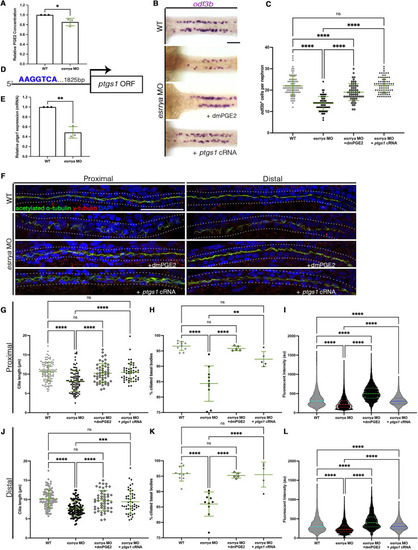
esrrγa controls ciliogenesis through regulation of prostaglandin signaling. (A) Relative PGE2 concentration. (B) WISH for MCCs (odf3b) at 28 ss. (C) MCCs per nephron. Each dot represents one nephron. Two nephrons were counted per animal. (D) Schematic of a putative Esrrγa binding site upstream of the ptgs1 open reading frame (ORF). (E) ptgs1 quantified via qRT-PCR. (F) IF for indicated markers at 28 hpf. Dotted lines indicate nephron tubule. (G,J) Cilia length in proximal (G) and distal (J) pronephros. Each dot represents one cilium. Ten cilia were measured per animal. (H,K) Percentage of ciliated basal bodies in proximal (H) and distal (K) pronephros. Each dot represents a single animal. (I,L) Fluorescent intensity plots (cilia, α-tubulin) for the same relative distance in proximal (I) and distal (L) pronephros. Each dot represents the fluorescent intensity of an animal at a given point across the segment of interest. (G-L) WT n=10, esrrγa MO n=10, esrrγa MO with dmPGE2n=5, esrrγa MO with ptgs1 cRNA n=5. Data are mean±s.d. *P<0.05, **P<0.01, ***P<0.001, ****P<0.0001 (unpaired t-test or one-way ANOVA). ns, not significant. Scale bars: 50 µm. |
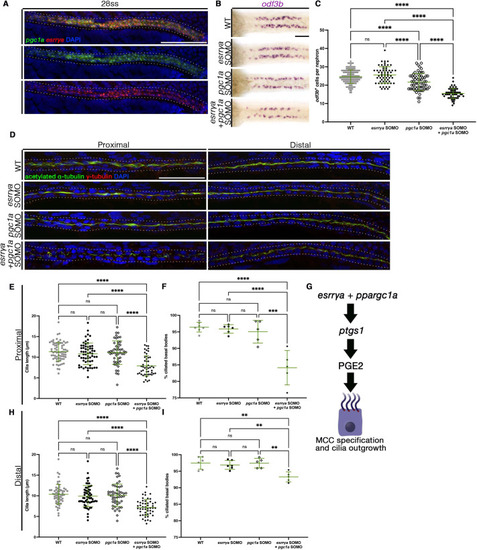
Genetic interaction of esrrγa and pgc1a drives MCC specification and ciliogenesis. (A) FISH reveals that esrrγa colocalizes with pgc1a in 24 hpf WT zebrafish. (B) MCCs stained via WISH (odf3b). (C) MCCs per nephron. Each dot represents one nephron. Two nephrons were measured per animal. (D) IF for indicated markers at 28 hpf. Dotted lines indicate nephron tubule. (E,H) Cilia length in proximal (E) and distal (H) pronephros. Each dot represents one cilium. Ten cilia were measured per animal. WT n=6, esrrγa SOMO n=6, pgc1a SOMO n=5, esrrγa and pgc1a SOMO n=5. (F,I) Percentage of ciliated basal bodies in proximal (F) and distal (I) pronephros. Each dot represents an individual. (G) esrrγa and pgc1a cooperate upstream of ptgs1 and PGE2 production to regulate MCC cell fate and ciliogenesis. Data are mean±s.d. **P<0.01, ****P<0.0001 (one-way ANOVA). ns, not significant. Scale bars: 50 µm. |
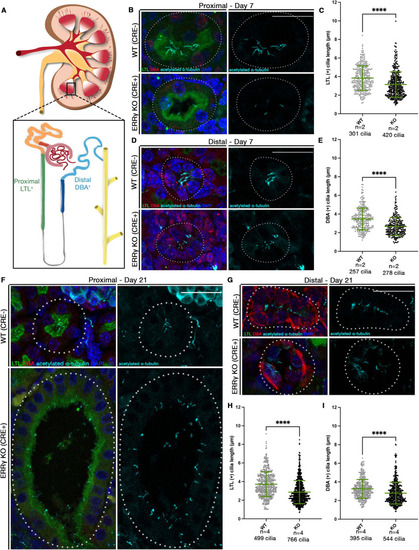
Murine ERRγ functions in ciliary development. (A) Schematic of mammalian kidney and nephron. Proximal segments are LTL+ and distal segments are DBA+. (B,D) IF for α-tubulin in LTL+ (B) and DBA+ (D) tubules (dotted outline) in 7-day-old animals. (C,E) Cilia length in LTL+ (C) and DBA+ (E) 7-day old animals. Number of animals given as n and number of cilia measured. (F,G) IF for α-tubulin in LTL+ (F) and DBA+ (G) tubule (dotted outlines) in 21-day-old animals. (H,I) Cilia length in LTL+ (H) and DBA+ (I) 21-day old animals. Number of animals given as n and the number of cilia measured. Data are mean±s.d. ****P<0.0001 (unpaired t-test). Scale bars: 25 µm. |