
- Title
-
Nr2f1a maintains atrial nkx2.5 expression to repress pacemaker identity within venous atrial cardiomyocytes of zebrafish
- Authors
- Martin, K.E., Ravisankar, P., Beerens, M., MacRae, C.A., Waxman, J.S.
- Source
- Full text @ Elife
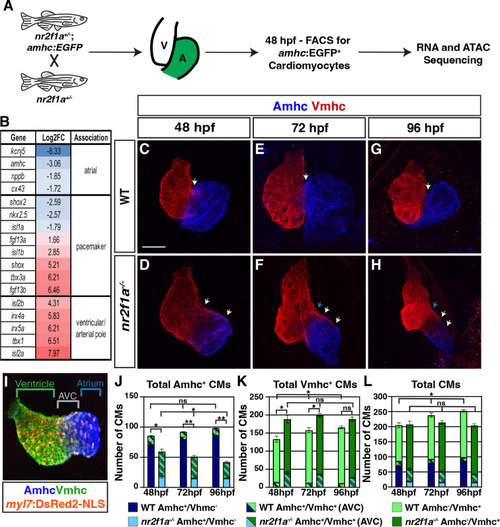
(A) Schematic for isolation of atrial cardiomyocytes (ACs) using Tg(amhc:EGFP) transgene for RNA-seq and assay for transpose-accessible chromatin sequencing (ATAC-seq) at 48 hr post-fertilization (hpf). (B) Differential expression of genes associated with ventricular cardiomyocyte (VC)/arterial pole, AC, and pacemaker cardiomyocyte (PC) differentiation in nr2f1a mutants compared to wild-type (WT). (C–H) IHC for Amhc (blue) and Vmhc (red) in nr2f1a and WT hearts at 48, 72, and 96 hpf. White arrows indicate region of overlapping Amhc+ and Vmhc+ cardiomyocytes in the AVC. Blue arrows indicate overt arterial position of the AVC of nr2f1a mutant atria. Number of embryos examined - 48 hpf: WT (n=3), nr2f1a-/- (n=4); 72 hpf: WT (n=4), nr2f1a-/- (n=6); 96 hpf: WT (n=7), nr2f1a-/- (n=10). (I) Schematic for cell quantification: Amhc+/Vmhc- (blue) cardiomyocytes (CMs) mark the atria; Amhc+/Vmhc+ (green/blue) cardiomyocytes mark the AVC; Amhc-/Vmhc+ (green) cardiomyocytes mark the ventricles; DsRed2-NLS (pan-cardiac) marks the cardiomyocyte nuclei. (J–L) Quantification of Amhc+/Vmhc- cardiomyocytes, Amhc+/Vmhc+ (AVC) cardiomyocytes, and Amhc-/Vmhc+ cardiomyocytes. Error bars indicate s.e.m. 48 hpf: WT (n=4), nr2f1a-/- (n=5); 72 hpf: WT (n=5), nr2f1a-/- (n=8); 96 hpf: WT (n=5), nr2f1a-/- (n=12). Scale bar indicates 50 μm. Differences between WT and nr2f1a-/- were analyzed using ANOVA with multiple comparisons. *p=0.05–0.001, **p<0.001.
|
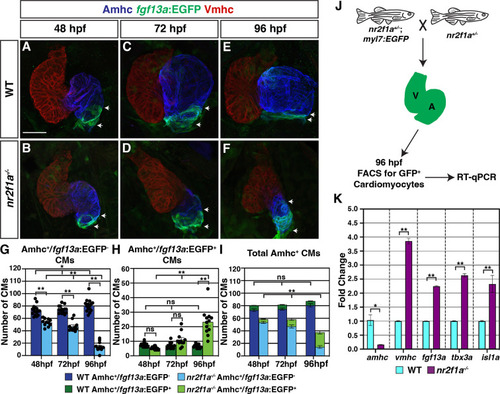
(A–F) IHC for Amhc (blue), Vmhc (red), and fgf13a:EGFP (green). White arrows indicate boundaries of Et(fgf13a:EGFP) expression within the atrium. Number of embryos examined - 48 hr post-fertilization (hpf): wild-type (WT) (n=10), nr2f1a-/- (n=12); 72 hpf: WT (n=10), nr2f1a-/- (n=10); 96 hpf: WT (n=7), nr2f1a-/- (n=10). (G–I) Quantification of Amhc+/fgf13a:EGFP-, Amhc+/fgf13a:EGFP+, and total Amhc+ cardiomyocytes (CMs) using the Tg(myl7:DsRed2-NLS) transgene within the hearts of WT and nr2f1a mutants. Error bars indicate s.e.m.; 48 hpf: WT (n=16), nr2f1a-/- (n=11); 72 hpf: WT (n=14), nr2f1a-/- (n=11); 96 hpf: WT (n=15), nr2f1a-/- (n=12). (J) Schematic for the isolation of cardiomyocytes at 96 hpf using the Tg(myl7:EGFP) transgene. (K) Fold change of marker genes relative to β-actin from real-time quantitative PCR (RT-qPCR) on isolated cardiomyocytes of WT and nr2f1a mutants at 96 hpf. Scale bar indicates 50 μm. Differences between WT and nr2f1a-/- were analyzed using ANOVA with multiple comparisons. *p=0.05–0.001, **p<0.001.
|
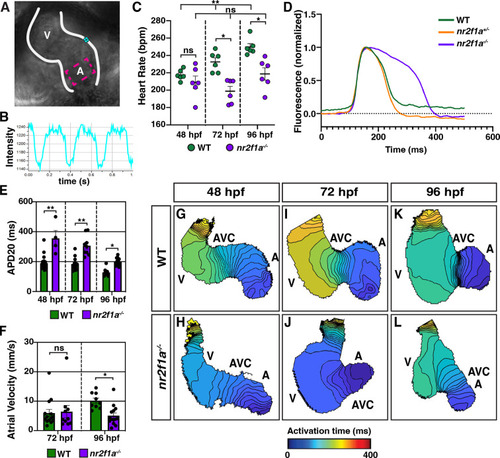
(A) Schematic of point placements to measure heart rate (cyan) and action potential duration at 20% repolarization (APD20) (magenta) in a 48 hr post-fertilization (hpf) heart. (B) Representative kymograph used to analyze heart rate in wild-type (WT) and nr2f1a mutant embryos. (C) Quantification of heart rate in WT and nr2f1a mutant embryos; 48 hpf: WT (n=6), nr2f1a-/- (n=6); 72 hpf: WT (n=6), nr2f1a-/- (n=6); 96 hpf: WT (n=6), nr2f1a-/- (n=6). (D) Representative atrial action potentials of WT, nr2f1a+/-, and nr2f1a-/- embryos at 96 hpf. (E) APD20 in WT and nr2f1a-/- hearts; 48hpf: WT (n=21), nr2f1a-/- (n=4); 72 hpf: WT (n=13), nr2f1a-/- (n=9); 96 hpf: WT (n=9), nr2f1a-/- (n=14). (F) Atrial velocity in WT and nr2f1a-/- hearts; 72 hpf: WT (n=13), nr2f1a-/- (n=9); 96 hpf: WT (n=9), nr2f1a-/- (n=14). (G–L) Representative isochronal maps illustrating the positions of the depolarizing wave front in 5 ms intervals for WT and nr2f1a-/- embryos at 48, 72, and 96 hpf; 48 hpf: WT (n=20), nr2f1a-/- (n=6) 72 hpf: WT (n=12), nr2f1a-/- (n=7) 96 hpf: WT (n=11), nr2f1a-/- (n=14). Differences between WT and nr2f1a-/- analyzed using ANOVA with multiple comparisons. Error bars in all graphs indicate s.e.m. *p=0.05–0.001, **p<0.001.
|
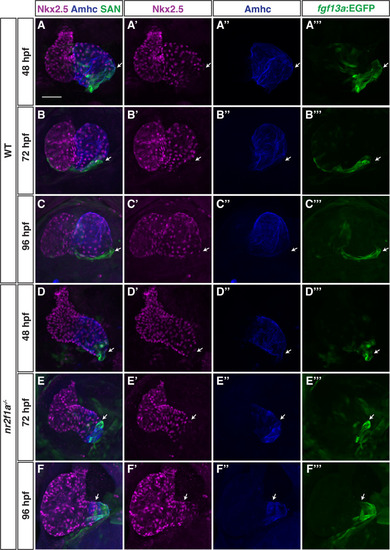
(A–F’’’) IHC for Nkx2.5 (purple), Amhc (blue), and fgf13a:EGFP (SAN - green) in wild-type (WT) and nr2f1a mutant embryos from 48 to 96 hr post-fertilization (hpf). White arrows indicate border of Nkx2.5+ and fgf13a:EGFP+ cardiomyocytes. Number of embryos examined - 48 hpf: WT (n=7), nr2f1a-/- (n=6); 72 hpf: WT (n=7), nr2f1a-/- (n=10); 96 hpf: WT (n=14), nr2f1a-/- (n=23). Scale bar indicates 50 μm.
|
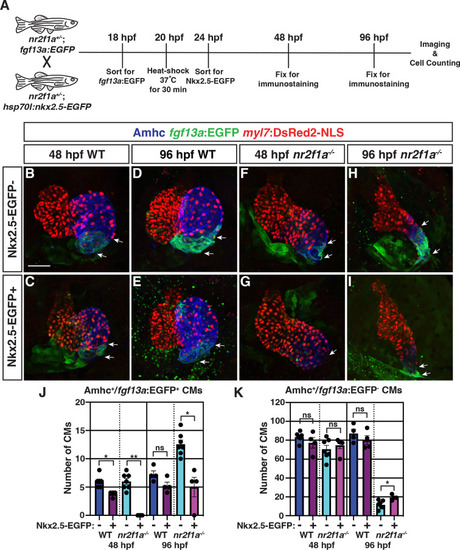
(A) Schematic of timeline for heat-shock experiments. (B–I) IHC of representative hearts for Amhc (blue), fgf13a:EGFP (green), and myl7:DsRed2-NLS (red) used to quantify Amhc+/fgf13a:EGFP+ cardiomyocytes (CMs) marking PCs from wild-type (WT) and nr2f1a mutant embryos with and without Nkx2.5-EGFP. White arrows indicate boundaries of Tg(fgf13a:EGFP) expression. Scale bar indicates 50 μm. (J–K) Quantification of Amhc+/fgf13a:EGFP+/myl7:DsRed2-NLS+ (PCs) and Amhc+/fgf13a:EGFP-/myl7:DsRed2-NLS+ cardiomyocytes in the atria with and without Nkx2.5-EGFP induction; 48 hpf WT: Nkx2.5-EGFP- (n=6), Nkx2.5-EGFP+ (n=4); 48 hpf nr2f1a-/-: Nkx2.5-EGFP- (n=7), Nkx2.5-EGFP+ (n=5); 96 hpf WT: Nkx2.5-EGFP- (n=4), Nkx2.5-EGFP+ (n=4); 96 hpf nr2f1a-/-: Nkx2.5-EGFP- (n=7), Nkx2.5-EGFP+ (n=4). Differences between WT and nr2f1a-/- at the different time points were analyzed using Student’s t-test. Error bars indicate s.e.m. *p=0.05–0.001, **p<0.001.
|
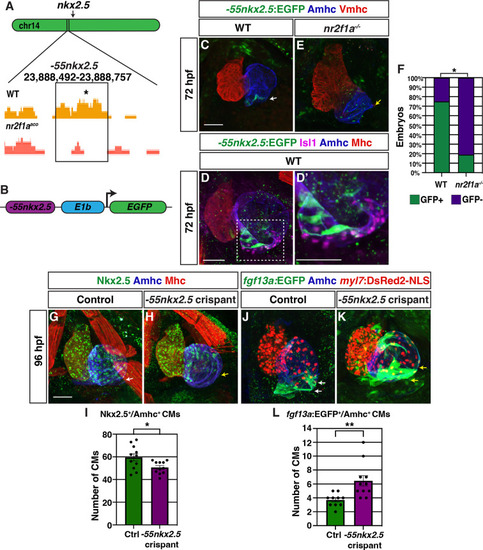
(A) Comparison of assay for transpose-accessible chromatin sequencing (ATAC-seq) peaks from wild-type (WT) and nr2f1a mutant amhc:EGFP+ cardiomyocytes at 48 hr post-fertilization (hpf), ~55 kb upstream of nkx2.5. Asterisk denotes canonical Nr2f binding site. (B) Schematic of –55 kb nkx2.5 enhancer reporter construct. (C) IHC for Tg(–55nkx2.5:EGFP) enhancer (green), Amhc (blue), and Vmhc (red) in hearts at 72 hpf. White arrow indicates –55nkx2.5:EGFP expression. (D–D’) IHC for –55nkx2.5:EGFP (green), Isl1 (purple), Amhc (blue), and sarcomeric myosin heavy chain (Mhc: pan-cardiac - red). The transgenic enhancer reporter is expressed in the ACs directly adjacent to the Isl1+ pacemaker cardiomyocytes (PCs). (E) IHC for Tg(–55nkx2.5:EGFP) enhancer (green), Amhc (blue), and Vmhc (red) in an nr2f1a mutant heart at 72 hpf. Expression of transgenic enhancer reporter is lost in nr2f1a mutants. Yellow arrow indicates venous pole devoid of –55nkx2.5:EGFP expression. (F) Comparison of percentage of WT and nr2f1a mutant embryos with –55nkx2.5:EGFP expression in the heart at 72 hpf WT (n=16); nr2f1a-/- (n=16), using Fisher’s exact test. (G,H) IHC for Nkx2.5 (green), Amhc (purple), and Mhc (red) in uninjected control and –55nkx2.5 crispant embryo hearts at 96 hpf. White arrow in (G) indicates the border of Nkx2.5+ cardiomyocytes extends close to the venous pole. Yellow arrow in (H) indicates that the Nkx2.5+ cardiomyocyte border is located farther from the venous pole of the atrium in crispant embryos. (I) Quantification of Nkx2.5+/Amhc+ cardiomyocytes in uninjected control (n=11) and –55nkx2.5 crispant (n=11) embryos at 96 hpf. (J,K) IHC for fgf13a:EGFP (green), Amhc (blue), and myl7:DsRed2-NLS (red) in uninjected control and –55nkx2.5 crispant Tg(fgf13a:EGFP)+ embryo hearts at 96 hpf. White arrows in (J) indicate the region of fgf13a:EGFP+ cardiomyocytes at the venous pole. Yellow arrows in (K) indicates that the region of fgf13a:EGFP+ cardiomyocytes is expanded from the venous pole in the atrium of crispant embryos. (L) Quantification of fgf13a:EGFP+/Amhc+ cardiomyocytes in uninjected control (n=10) and –55nkx2.5 crispant (n=11) embryo hearts at 96 hpf. Differences between uninjected control and –55nkx2.5 crispants were analyzed using Student’s t-test. Error bars indicate s.e.m. *p=0.05–0.001, **p<0.001. Scale bars in all images indicate 50 μm.
|
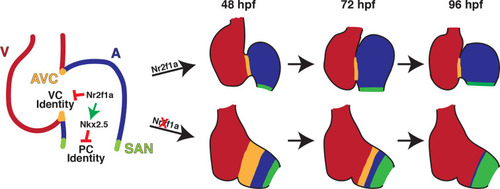
Following its initial requirement promoting atrial cardiomyocyte (AC) differentiation (Duong et al., 2018), Nr2f1a is required to maintain AC identity within the arterial (outflow) and venous (inflow) regions of the zebrafish atrium. In the absence of Nr2f1a, cardiomyocytes within the enlarged atrioventricular canal (AVC), where there is expression of both AC and ventricular cardiomyocyte (VC) differentiation markers, progressively lose expression of AC differentiation markers and only express VC differentiation markers. Concurrently, more venous ACs progressively gain PC differentiation marker expression.
|