
|
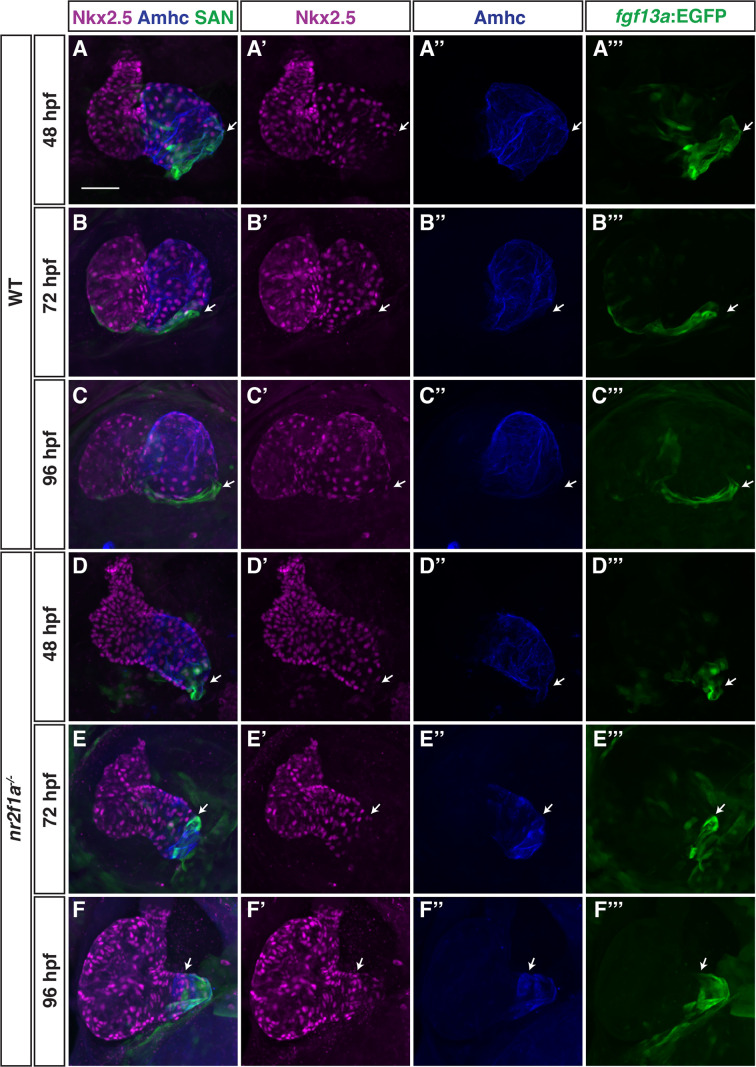
Figure 4
(A–F’’’) IHC for Nkx2.5 (purple), Amhc (blue), and fgf13a:EGFP (SAN - green) in wild-type (WT) and nr2f1a mutant embryos from 48 to 96 hr post-fertilization (hpf). White arrows indicate border of Nkx2.5+ and fgf13a:EGFP+ cardiomyocytes. Number of embryos examined - 48 hpf: WT (n=7), nr2f1a-/- (n=6); 72 hpf: WT (n=7), nr2f1a-/- (n=10); 96 hpf: WT (n=14), nr2f1a-/- (n=23). Scale bar indicates 50 μm.
Nkx2.5 expression recedes from venous pole in nr2f1a mutant atria.