
- Title
-
Deterministic and probabilistic fate decisions co-exist in a single retinal lineage
- Authors
- Nerli, E., Kretzschmar, J., Bianucci, T., Rocha-Martins, M., Zechner, C., Norden, C.
- Source
- Full text @ EMBO J.

Atoh7+ progenitors divide asymmetrically to produce a PRpr and a sister cell Schematic of the Atoh7+ lineage and open questions in fate decisions. Cell fate assignment strategy based on (left) mode of migration and (right) morphology and final neuronal position in the laminated retina. Plot on the left indicates typical movement trajectories for each cell type. Montage of Atoh7+ progenitor division generating an RGC (magenta dot) and a PRpr (cyan dot). Dashed line indicates the apical side and arrowhead points to RGC axon. atoh7:GFP-CAAX (Atoh7, grey). Scale bar 10 μm. Montage of Atoh7+ progenitor division generating an HC (orange dot) and a PRpr (cyan dot). Dashed line indicates the apical side. atoh7:GFP-CAAX (Atoh7, grey). Scale bar 10 μm. Montage of Atoh7+ progenitor division generating an AC (yellow dot) and a PRpr (cyan dot). Dashed line indicates the apical side and arrowhead points to basal dendrites. atoh7:GFP-CAAX (Atoh7, grey). Scale bar 10 μm. Photoconversion experiment. A 405 laser was used to photoconvert isolated cells labelled with Crx:H2BDendra at 42 hpf. Twenty-four hours after photoconversion, photoconverted PRs were assessed. (Top) Schematic of the experiment and (bottom) representative images of the different steps of the experiment. Crx:H2BDendra (green) and photoconverted Crx:H2BDendra (magenta). Scale bar 10 μm, white line indicates apical side of the retina. Schematics of the Atoh7+ lineage showing possible outcomes of Atoh7+ divisions and PRpr divisions. Distribution of fates for the sister cell of the PRpr acquired during early and late neurogenic windows. Amacrine cells and horizontal cells are pooled into the Inhibitory neurons (IN) category. N = 13 embryos, n = 96 Atoh7+ divisions. Mean and 95% CI are indicated. Event plot of all divisions analysed in (H). |

Perturbing the deterministic PRpr fate decision affects lineage and overall tissue development Two examples of retinas at 48 hpf in (left) control and (right) Prdm1a morphant (MO). Atoh7+ cells (magenta), inhibitory neurons (yellow) and photoreceptors (cyan) are labelled. Scale bar 50 μm. (A′) Close-up of Crx (cyan), signal (upper panel) and DAPI (grey, lower panel) from (A) for controls (left) and Prdm1a morphant (right). Scale bar 20 μm. Staining for the photoreceptor cell marker zpr-1 at 72 hpf in (left) control and (right) Prdm1a knockdown. Atoh7+ cells (magenta), inhibitory neurons (yellow), photoreceptors (cyan) and zpr-1 (grey). Scale bar 50 μm. Arrowheads indicate zpr-1 staining. (B′) Close-up of Atoh7 (magenta) and Crx (cyan) signal (upper panel), together with Zpr-1 (grey, lower panel) from (B), for controls (left) and Prdm1a morphant (right). Scale bar 20 μm. Schematics of layer thickness and retinal diameter measurements in the central part of the retina. Measurements of retinal diameter in control (black dots) and Prdm1a knockdown (empty dots) at 24, 36, 48 and 72 hpf. N and P-values are found in Table 2. **** for P < 0.0001, Two-way ANOVA with Bonferroni correction. Mean and single values are indicated. Layer thickness analysis in control and Prdm1a knockdown embryos at 72 hpf. N = 4 embryos (control) and 6 embryos (Prdm1a morphant). Total thickness comparison: P = 0.0055; GCL comparison, P < 0.0001; INL comparison, ns; ONL comparison, P = 0.0369. Two-way ANOVA with Bonferroni correction. Mean and SD are indicated, as well as single values. Montage of Atoh7+ progenitor division upon Prdm1a knockdown, generating an RGC (magenta dot) and a non-canonical sister cell (violet dot). Dashed line indicates the apical side and arrows indicate the dynamic basal process of the sister cell. atoh7:GFP-CAAX (Atoh7, grey). Scale bar 10 μm. Arrowheads point to the dynamic basal process of the non-canonical sister cell. Schematic comparison of the outcome of Atoh7+ progenitors in control and Prdm1a morphants. |

Probabilistic lineage branch shows flexibility upon interference with fate probabilities Retina at 72 hpf in (top left) control, (top right) Atoh7 knockdown, (bottom left) Ptf1a knockdown and (bottom right) Atoh7 and Ptf1a knockdown. Atoh7+ cells (magenta), inhibitory neurons (yellow) and photoreceptors (cyan). Scale bar 50 μm, 20 μm in close-up panels. Layer thickness analysis in control and morphant embryos measured at 72 hpf. N = 9 embryos (control), 7 embryos (Atoh7 morphant), 7 embryos (Ptf1a morphant) and 7 embryos (Atoh7 + Ptf1a morphant). P-values for thickness measurements are found in Table 3. Mixed-effects analysis with Bonferroni correction. Mean and SD are indicated, as well as single values. Number of PH3+ cells per retina in control and morphant conditions at 28, 32 and 36 hpf. N = 4 to 10 embryos per condition, mixed-effects analysis with Dunnett's correction. All comparisons are statistically non-significant. Mean and SD are indicated, as well as single values. Schematic comparison of the outcome of Atoh7+ progenitor divisions in control and morphants. Proportions of PRpr sister cell fates during early neurogenesis. Mean and 95% CI are indicated. For Atoh7 morphants, n = 48 divisions and N = 4 embryos. For Ptf1a morphants, n = 39 divisions and N = 4 embryos. For Atoh7 + Ptf1a morphants, n = 62 divisions and N = 4 embryos. Proportions of PRpr sister cell fates during late neurogenesis. Mean and 95% CI are indicated. For Atoh7 morphants, n = 47 divisions and N = 4 embryos. For Ptf1a morphants, n = 41 divisions and N = 5 embryos. For Atoh7 + Ptf1a morphants, n = 50 divisions and N = 4 embryos. Montage of neurogenic progenitor division upon Atoh7 and Ptf1a knockdown, generating two PRprs (cyan dots). Dashed line indicates the apical side. atoh7:GFP-CAAX (Atoh7, grey). Scale bar 10 μm. Montage of neurogenic progenitor division upon Atoh7 and Ptf1a knockdown, generating a BC (blue dot) and a PRpr (cyan dot). Dashed line labels the apical side, yellow arrow points at BC apical process and white arrows point at BC basal process. atoh7:GFP-CAAX (Atoh7, grey). Scale bar 10 μm. |
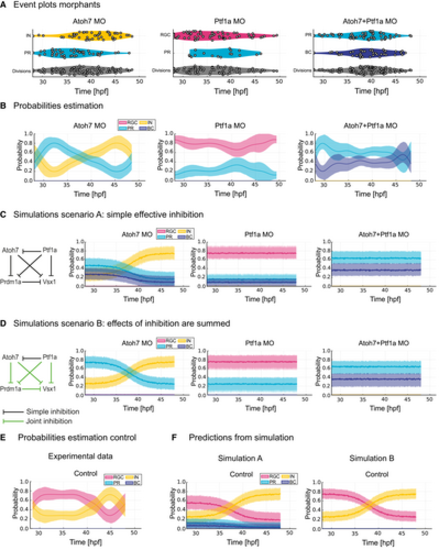
A simple theoretical gene regulatory network reproduces temporal changes in progenitor competence Distribution of each Atoh7+ division in time (event plots) from 28 hpf in Atoh7 morphants, Ptf1a morphants and double Atoh7/Ptf1a morphants. Coloured violin plots indicate different fates and grey violin plots show all neurogenic divisions analysed. Time in hpf. Probability estimation from lineage data in (A) for each fate outcome at the time at which an Atoh7+ division occurs in Atoh7 morphants, Ptf1a morphants and double Atoh7/Ptf1a morphants. Time in hpf. Mean (dark line) and 95% confidence interval (thick transparent stripe) are plotted. Simulation scenario A run using a simple GRN tested based on the hypothesis formulated based on the probability estimation plots in (B). Mean (dark line) and 95% confidence interval (thick transparent stripe) are plotted. Simulation scenario B run using a simple GRN in which inhibitory effects of two or more TFs are summed (green lines), and tested based on the hypothesis formulated based on the probability estimation plots in (B). Mean (dark line) and 95% confidence interval (thick transparent stripe) are plotted. Probability estimation from lineage data in Fig 1I for each fate outcome at the time at which an Atoh7+ division occurs in controls. Time in hpf. Mean (dark line) and 95% confidence interval (thick transparent stripe) are plotted. Prediction of fate shares in the control situation using Simulation Scenario A (left) and Simulation Scenario B (right). Mean (dark line) and 95% confidence interval (thick transparent stripe) are plotted. |

Atoh7+ progenitor divisions producing a PRpr and a sister cell |

Prdm1a knockdown depletes PRs |
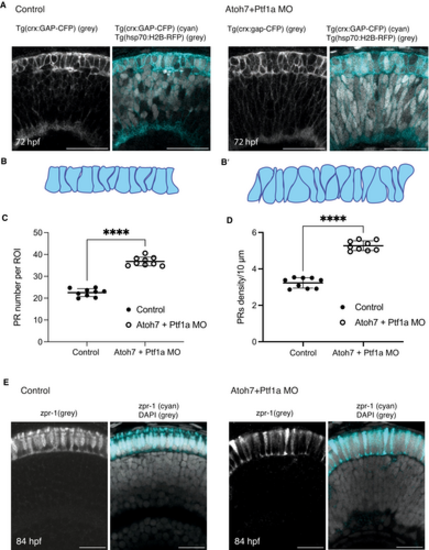
Photoreceptor layer morphology is altered in Atoh7 + Ptf1a double morphant condition |
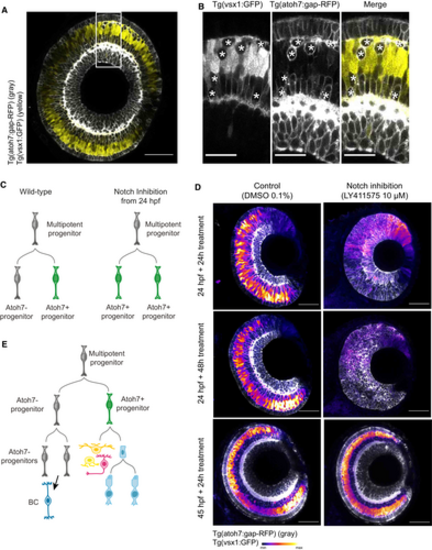
Bipolar cells originate from the Atoh7-negative sister cell of the Atoh7+ progenitor |

Absence of key TFs does not alter overall lineage topology |