
|
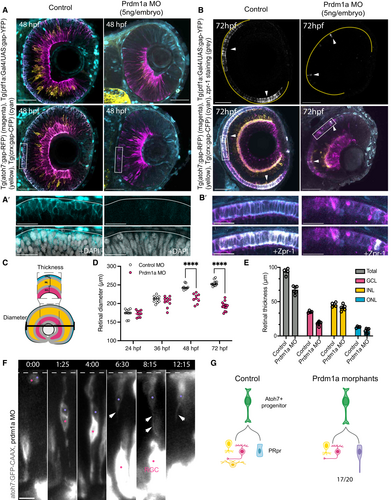
Fig. 2 Perturbing the deterministic PRpr fate decision affects lineage and overall tissue development Two examples of retinas at 48 hpf in (left) control and (right) Prdm1a morphant (MO). Atoh7+ cells (magenta), inhibitory neurons (yellow) and photoreceptors (cyan) are labelled. Scale bar 50 μm. (A′) Close-up of Crx (cyan), signal (upper panel) and DAPI (grey, lower panel) from (A) for controls (left) and Prdm1a morphant (right). Scale bar 20 μm. Staining for the photoreceptor cell marker zpr-1 at 72 hpf in (left) control and (right) Prdm1a knockdown. Atoh7+ cells (magenta), inhibitory neurons (yellow), photoreceptors (cyan) and zpr-1 (grey). Scale bar 50 μm. Arrowheads indicate zpr-1 staining. (B′) Close-up of Atoh7 (magenta) and Crx (cyan) signal (upper panel), together with Zpr-1 (grey, lower panel) from (B), for controls (left) and Prdm1a morphant (right). Scale bar 20 μm. Schematics of layer thickness and retinal diameter measurements in the central part of the retina. Measurements of retinal diameter in control (black dots) and Prdm1a knockdown (empty dots) at 24, 36, 48 and 72 hpf. N and P-values are found in Table 2. **** for P < 0.0001, Two-way ANOVA with Bonferroni correction. Mean and single values are indicated. Layer thickness analysis in control and Prdm1a knockdown embryos at 72 hpf. N = 4 embryos (control) and 6 embryos (Prdm1a morphant). Total thickness comparison: P = 0.0055; GCL comparison, P < 0.0001; INL comparison, ns; ONL comparison, P = 0.0369. Two-way ANOVA with Bonferroni correction. Mean and SD are indicated, as well as single values. Montage of Atoh7+ progenitor division upon Prdm1a knockdown, generating an RGC (magenta dot) and a non-canonical sister cell (violet dot). Dashed line indicates the apical side and arrows indicate the dynamic basal process of the sister cell. atoh7:GFP-CAAX (Atoh7, grey). Scale bar 10 μm. Arrowheads point to the dynamic basal process of the non-canonical sister cell. Schematic comparison of the outcome of Atoh7+ progenitors in control and Prdm1a morphants.