
- Title
-
Metaphocytes are IL-22BP-producing cells regulated by ETS transcription factor Spic and essential for zebrafish barrier immunity
- Authors
- Zhao, C., Li, Y., Tang, J., Zhou, Q., Lin, X., Wen, Z.
- Source
- Full text @ Cell Rep.
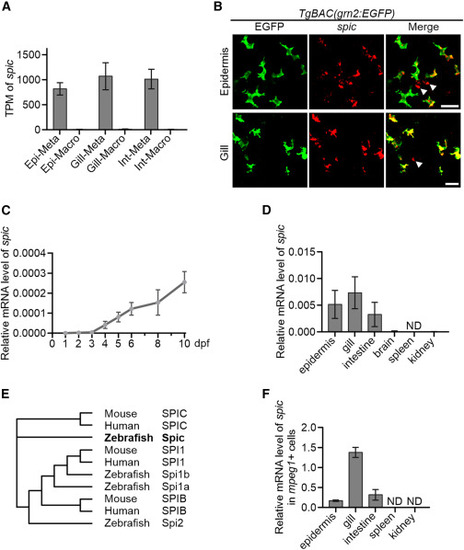
spic is highly enriched in metaphocytes (A) TPM values of spic in metaphocytes and macrophages of zebrafish barrier tissues by bulk RNA-seq. Values are represented as mean ± SD (n ≥ 7). Epi, epidermis; Int, intestine; Meta, metaphocytes; Macro, macrophages. (B) ISH detection of spic in the epidermis and gill of TgBAC(grn2:EGFP) fish. Arrowheads indicate the spic signals that are not co-stained with the EGFP+ metaphocytes. Scale bars, 20 μm. (C) qPCR detection of the relative expression level of spic at early development stages of zebrafish. eef1a1l1 was utilized as the internal control. Values are represented as mean ± SD (n = 6). (D) qPCR detection of the relative expression level of spic in adult organs. eef1a1l1 was utilized as the internal control. Values are represented as mean ± SD (n ≥ 3). ND, not detected. (E) Phylogenetic analysis of PU.1-related transcription factors from the zebrafish, mouse, and human. (F) qPCR detection of the relative expression level of spic in mpeg1:DsRedx+ cells from adult organs. eef1a1l1 was utilized as the internal control. Values are represented as mean ± SD (n ≥ 3). ND, not detected. See also Figure S1. |

spic deficiency results in the depletion of metaphocytes (A) Schematic outline of the generation of spic mutants by CRISPR-Cas9. (B) Representative images of the epidermis and gill of Tg(grn2:EGFP;mpeg1:DsRedx);spicΔ136 mutants and siblings. EGFP+DsRedx+ cells are metaphocytes and EGFP−DsRedx+ cells are macrophages. Scale bar, 50 μm. (C) qPCR detection of the relative expression level of metaphocyte marker genes in the epidermis and gill of spicΔ136 mutants and siblings. eef1a1l1 was utilized as the internal control. Values are represented as mean ± SD (n = 4). ∗p < 0.05, ∗∗p < 0.01, ∗∗∗p < 0.001. epi, epidermis; sib, sibling; mut, mutant. See also Figure S2. |
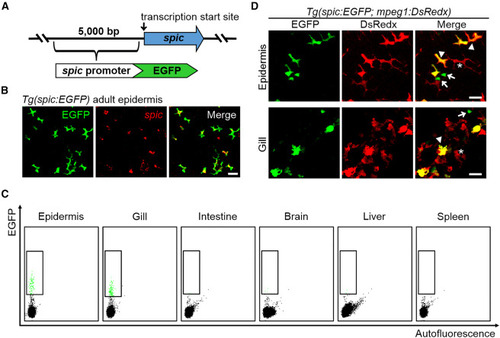
Tg(spic:EGFP) reporter line specifically marks metaphocytes in the epidermis and gill (A) Schematic outline of the generation of spic reporter line 5 kb promoter sequence immediately upstream of the transcription start site of spic was cloned to drive the expression of EGFP. (B) ISH detection of spic in the epidermis of Tg(spic:EGFP) fish. Scale bar, 20 μm. (C) FACS analysis of spic:EGFP+ cells in adult tissues of the Tg(spic:EGFP) fish. WT ABSR fish without fluorescent signals were utilized as the negative control for gating. (D) Representative images of the epidermis and gill of Tg(spic:EGFP;mpeg1:DsRedx) fish. Asterisks, EGFP−DsRedx+ macrophages; arrowheads, EGFP+DsRedx+ metaphocytes; arrows, EGFP+DsRedx− metaphocyte progenitor cells. Scale bars, 20 μm. |

Mature metaphocytes are generated from spic+ progenitors (A) Schematic outline of the ex vivo scale culture system. Scales with intact epidermis were collected from anesthetized fish and cultured in the L15 medium for time-lapse imaging. (B) Time-lapse imaging of the epidermis of Tg(spic:EGFP;mpeg1:DsRedx) fish. Arrowheads indicate that an EGFP+DsRedx− progenitor cell undergoes cell division to produce two daughter cells, arrows indicate mature metaphocytes with high mobility, and asterisks indicate immature metaphocytes which barely move and have a weak DsRedx signal. Scale bar, 20 μm. (C) Left: representative images of the epidermis of Tg(spic:EGFP;mpeg1:DsRedx;grn2:EGFP-NTR) fish before and after MTZ treatment. Scale bar, 50 μm. Right: time-lapse imaging of the epidermis of Tg(spic:EGFP;mpeg1:DsRedx;grn2:EGFP-NTR) fish starts from 9 h after metaphocytes depletion. The arrowheads indicate an EGFP+DsRedx− progenitor cell that displays and gradually increases the DsRedx signal. The arrows indicate an EGFP+DsRedx+ immature metaphocytes that gradually increases the DsRedx signal. Scale bar, 20 μm. |

scRNA-seq transcriptome profiling of metaphocyte development (A) Uniform Manifold Approximation and Projection clustering of spic:EGFP+ cells identified metaphocytes of different states. Meta, metaphocytes. (B) CPM value of mpeg1.1 and krt4 in metaphocytes of different stages. (C) Pseudotime trajectory analysis of spic:EGFP+ cells. Metaphocytes of S0, S1, and S2 are sequentially aligned along the pseudotime trajectory. (D) GO terms enriched in the genes gradually upregulated along the pseudotime trajectory. (E) Relative expression of gradually upregulated genes in metaphocytes of different stages. See also Figure S3. |

spic deficiency blocks progenitor differentiation (A) Representative images of the epidermis of Tg(spic:EGFP;mpeg1:DsRedx);spicΔ136 mutants and siblings. The arrow indicates the mature metaphocytes and the asterisk indicates the immature metaphocytes. The arrowheads indicate the progenitor cells. Scale bar, 50 μm. (B) The density of progenitor cells in the epidermis of spicΔ136 mutants and siblings. Values are represented as mean ± SD (n of siblings is 20; n of mutants is 24). ∗∗∗p < 0.001. (C) Representative images of FACS analysis of metaphocytes and progenitor cells in the epidermis and gill of spicΔ136 mutants and siblings. (D) GO terms enriched in the common downregulated genes of mutant progenitor cells in the epidermis and gill. (E) Fold change of gene expression after ectopic overexpression of spic or mCherry in zebrafish embryos. Values are represented as mean ± SD (n = 4). ∗∗p < 0.01, ∗∗∗p < 0.001. ND, not detected. See also Figure S4. |
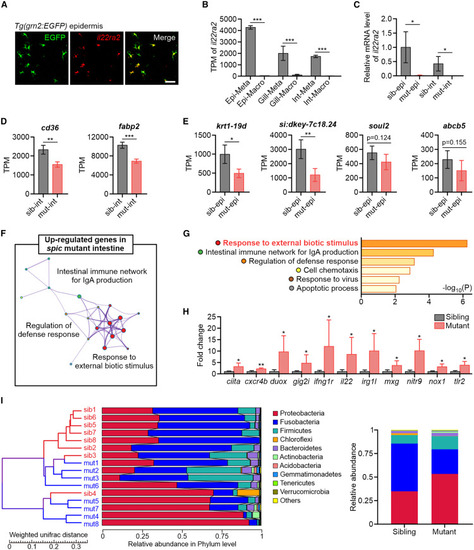
Metaphocytes are the major source of Il22ra2 and modulate immunity in barrier tissues (A) ISH detection of il22ra2 in the epidermis of TgBAC(grn2:EGFP) fish. Scale bar, 50 μm. (B) TPM values of il22ra2 in metaphocytes and macrophages of zebrafish barrier tissues by bulk RNA-seq. Values are represented as mean ± SD (n ≥ 7). ∗∗∗p < 0.001. Epi, epidermis; Int, intestine; Meta, metaphocytes; Macro, macrophages. (C) qPCR detection of the relative expression level of il22ra2 in the epidermis and intestine of spicΔ136 mutants and siblings. eef1a1l1 was utilized as the internal control. Values are represented as mean ± SD (n = 4). ∗p < 0.05. epi, epidermis; int, intestine; sib, sibling; mut, mutant. (D) TPM values of lipid transporter and metabolic genes in the intestine of spicΔ136 mutants and siblings by whole-tissue RNA-seq. Values are represented as mean ± SD (n = 4). ∗∗p < 0.01, ∗∗∗p < 0.001. (E) TPM values of keratinocyte terminal differentiation marker genes in the epidermis of spicΔ136 mutants and siblings by whole-tissue RNA-seq. Values are represented as mean ± SD (n = 4). ∗p < 0.05, ∗∗p < 0.01. (F) Main GO clusters enriched in the upregulated genes of spicΔ136 mutant intestine. (G) GO terms enriched in the upregulated genes of spicΔ136 mutant intestine. (H) Expression fold change of the representative genes of the GO term “response to external biotic stimulus” in the intestine of spicΔ136 mutants compared with that in siblings. Values are represented as mean ± SD (n = 4). ∗p < 0.05, ∗∗p < 0.01. (I) Left: cluster tree of spicΔ136 mutants and siblings based on intestinal microbiome composition by UPGMA method. Right: the relative abundance of intestinal microbiome phylum in adult spicΔ136 mutants and siblings. See also Figure S5. |