FIGURE SUMMARY
Title

Gut-specific telomerase expression counteracts systemic aging in telomerase-deficient zebrafish

Authors
El Maï, M., Bird, M., Allouche, A., Targen, S., Şerifoğlu, N., Lopes-Bastos, B., Guigonis, J.M., Kang, D., Pourcher, T., Yue, J.X., Ferreira, M.G.
Source
Full text @ Nat Aging

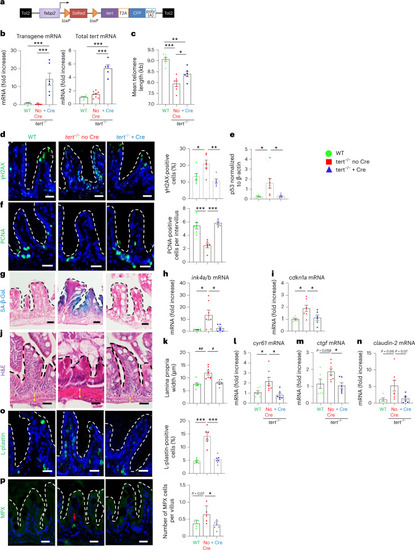
Gut-specific and Cre-mediated tert expression rescues gut aging phenotypes.

a, Schematic representation of the transgene for Cre-inducible and tissue-specific expression of tert mRNA. b, RT–qPCR analysis of tert transgene mRNA and total tert mRNA (endogenous + transgene) expression in 9-month-old gut extracts (nWT = 5 and 6; 𝑛𝑡𝑒𝑟𝑡/noCre = 7 and 8 and 𝑛𝑡𝑒𝑟𝑡/+Cre = 6 and 5 fish, respectively; levels were normalized by rps11 gene expression levels). c, Quantification of mean telomere length by TRF analysis (nWT = 7; 𝑛𝑡𝑒𝑟𝑡/noCre = 7 and 𝑛𝑡𝑒𝑟𝑡/+Cre = 6 fish). d, Representative immunofluorescence images of DNA damage staining (γH2AX; left) and quantification (right; nWT = 6; 𝑁𝑡𝑒𝑟𝑡/noCre = 6 and 𝑛𝑡𝑒𝑟𝑡/+Cre = 6 fish). e, Quantification of p53 protein levels (normalized by β-actin) analyzed by western blot (nWT = 6; 𝑁𝑡𝑒𝑟𝑡/noCre = 7 and 𝑛𝑡𝑒𝑟𝑡/+Cre = 6 fish). f, Representative immunofluorescence images of proliferation staining (left, proliferation cell nuclear antigen (PCNA)) and quantification (right, nWT = 6; 𝑛𝑡𝑒𝑟𝑡/noCre = 6 and 𝑛𝑡𝑒𝑟𝑡/+Cre = 6 fish). g, Representative image of SA-β-Gal staining. h,i, RT–qPCR analysis of the senescence-associated genes ink4a/b (p15/16) (h) and cdkn1a (p21) (i) expression (nWT = 6; 𝑛𝑡𝑒𝑟𝑡/noCre = 7 and 𝑛𝑡𝑒𝑟𝑡/+Cre = 6 fish). j,k, Representative hematoxylin and eosin (H&E)-stained sections of the gut (j). The yellow arrows delineate the lamina propria width quantified in k (nWT = 7; 𝑛𝑡𝑒𝑟𝑡/noCre = 8 and 𝑛𝑡𝑒𝑟𝑡/+Cre = 7 fish). l,m, RT–qPCR analysis of the YAP target genes cyr61 (l) and ctgf expression (m) (nWT = 6; 𝑛𝑡𝑒𝑟𝑡/noCre = 8 and 𝑛𝑡𝑒𝑟𝑡/+Cre = 6 fish). n, RT–qPCR analysis of the junction protein-associated gene claudin-2 expression (nWT = 5; 𝑛𝑡𝑒𝑟𝑡/noCre = 7 and 𝑛𝑡𝑒𝑟𝑡/+Cre = 6 fish). o, Representative immunofluorescence images of immune cell staining (left, L-plastin) and quantification (right, nWT = 6 fish; 𝑛𝑡𝑒𝑟𝑡/noCre = 6 fish and 𝑛𝑡𝑒𝑟𝑡/+Cre = 7 fish). p, Representative immunofluorescence images of neutrophil staining (left, myeloperoxidase (MPX)) and quantification (right, nWT = 5 fish; 𝑛𝑡𝑒𝑟𝑡/noCre = 5 fish and 𝑛𝑡𝑒𝑟𝑡/+Cre = 6 fish). All analyses are based on 9-month-old fish gut sections or extracts. Scale bar, 20 µm. The dashed lines delineate the gut villi. All data are presented as the mean ± s.e.m. *P < 0.05, **P < 0.01, ***P < 0.001, using a one-way ANOVA and post hoc Tukey test; *P < 0.05, **P < 0.01, using a Kruskal–Wallis and post hoc Dunn test.

Source data

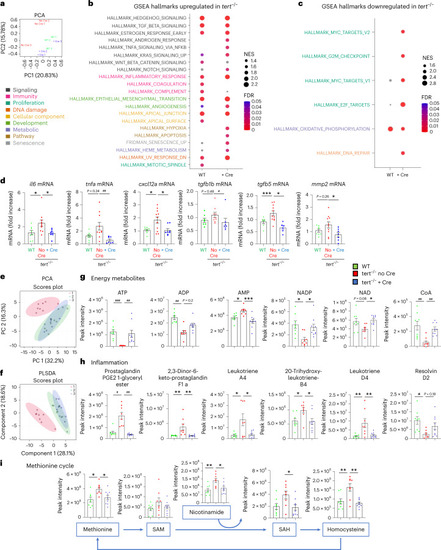
Gut-specific tert expression rescues gut transcriptomics and metabolomics profiles.

a, Principal component analysis (PCA)-based on untargeted transcriptomics data of 9-month-old gut samples. A clustering between tert−/− + Cre and WT was observed while the tert−/− no Cre group was clearly distinguishable from tert−/− no Cre fish (n = 3 per group). b,c, Identification of upregulated (b) or downregulated (c) hallmarks in tert−/− no Cre compared to either WT or tert−/− + Cre, based on GSEA. The normalized enrichment scores (NES) depict to what degree the pathway genes are overrepresented in WT or tert−/− + Cre, compared to tert−/− no Cre. Gene sets related to senescence, inflammation and morphogenesis were enriched while the hallmarks of proliferation and oxidative phosphorylation were downregulated in the gut of tert−/− no Cre fish compared to the other two groups. d, RT–qPCR analysis of inflammation-related gene expression (il6, tnfa, tgfb1b and tgfb5) and SASP-related gene expression (il6, tnfa, cxcl12a, tgfb1b, tgfb5 and mmp2) in 9-month-old gut samples (nWT = 8 fish, 𝑛𝑡𝑒𝑟𝑡/noCre = 10 fish and 𝑛𝑡𝑒𝑟𝑡/+Cre = 8 fish for il6; nWT = 8 fish, 𝑛𝑡𝑒𝑟𝑡/noCre = 9 fish and 𝑛𝑡𝑒𝑟𝑡/+Cre = 8 fish for tnfa; nWT = 8 fish, 𝑛𝑡𝑒𝑟𝑡/noCre = 11 fish and 𝑛𝑡𝑒𝑟𝑡/+Cre = 8 fish for cxcl12; nWT = 7 fish, 𝑛𝑡𝑒𝑟𝑡/noCre = 9 fish and 𝑛𝑡𝑒𝑟𝑡/+Cre = 7 fish for tgfb1b; nWT = 7 fish, 𝑛𝑡𝑒𝑟𝑡/noCre = 11 fish and 𝑛𝑡𝑒𝑟𝑡/+Cre = 6 fish for tgfb5; and nWT = 8 fish, 𝑛𝑡𝑒𝑟𝑡/noCre = 10 fish and 𝑛𝑡𝑒𝑟𝑡/+Cre = 7 fish for mmp2). e,f, PCA (e) and partial least squares discriminant analysis (PLS-DA) (f) clustering analysis based on untargeted metabolomics data of 9-month-old gut samples. A clustering between tert−/− + Cre and WT was observed while the tert−/− no Cre group was clearly distinguishable from the other (nWT = 8 fish, 𝑛𝑡𝑒𝑟𝑡/noCre = 8 fish and 𝑛𝑡𝑒𝑟𝑡/+Cre = 9 fish). The score plot is presented with a confidence ellipse of 95%. gi, Metabolomics analysis of energy metabolites (g), inflammatory metabolites (h) and methionine cycle pathway (i) in 9-month-old gut samples (nWT = 8 fish, 𝑛𝑡𝑒𝑟𝑡/noCre = 8 fish and 𝑛𝑡𝑒𝑟𝑡/+Cre = 9 fish). All data are presented as the mean ± s.e.m.; *P < 0.05, **P < 0.01, ***P < 0.001, using a one-way ANOVA and post hoc Tukey test; *P < 0.05; *P < 0.01, ***P < 0.001, using a Kruskal–Wallis and post hoc Dunn test).

Source data

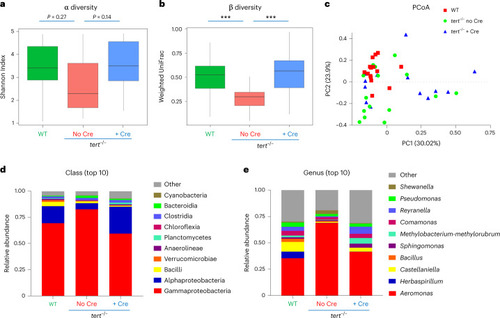
Gut-specific tert expression rescues gut microbiota dysbiosis.

Telomere elongation in the gut of tert−/− + Cre fish rescued gut microbiota composition and diversity to WT levels compared to tert−/− no Cre fish, which exhibited gut microbiota dysbiosis. a, Quantification of microbiome α diversity (within samples) using the Shannon index (P values were determined using a two-sided Wilcoxon signed-rank test) in the gut of 9-month-old fish. b, Quantification of microbiome β diversity using weighted UniFrac distance (within groups; ***P < 0.001 using a two-sided Tukey test) in the gut of 9-month-old fish. c, PCoA of the β diversity distance (weighted UniFrac) in the gut of 9-month-old fish. d, Relative abundance of top 10 bacterial classes in the microbiome of the three different groups in the gut of 9-month-old fish. e, Relative abundance of top 10 bacterial genera in the microbiome of the three different groups in the gut of 9-month-old fish. For all the figures, nWT = 15 fish, 𝑛𝑡𝑒𝑟𝑡/noCre = 15 fish and 𝑛𝑡𝑒𝑟𝑡/+Cre = 14 fish; α and β diversity data are shown as Tukey boxplots, where the boxes represent the median and interquartile range and the bars represent the minimum and maximum values.

Source data

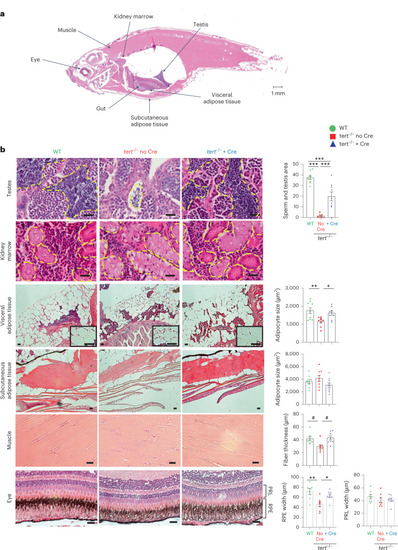
Gut-specific tert expression rescues systemic tissue degeneration.

Expression of telomerase in the gut of tert mutant fish rescued tissue degeneration in the testes, visceral adipose tissue, muscle and eye. a, Representative image of a longitudinal section of a zebrafish stained with H&E. The locations of each tissue analyzed in the study are indicated by arrows. b, Representative images of testes, kidney, visceral adipose tissue, subcutaneous adipose tissue, muscle and eye from 9-month-old fish stained with H&E (right). Except for the kidney, histological quantifications were performed for each tissue (left), namely the mature spermatids area (nWT = 10 fish, 𝑛𝑡𝑒𝑟𝑡/noCre = 8 fish and 𝑛𝑡𝑒𝑟𝑡/+Cre = 9 fish), adipocyte area (nWT = 9 fish, 𝑛𝑡𝑒𝑟𝑡/noCre = 9 fish and 𝑛𝑡𝑒𝑟𝑡/+Cre = 9 fish), muscle fiber thickness (n = 8 fish per group), retinal pigmented epithelium (RPE) and photoreceptor layer (PRL) (nWT = 7 fish, 𝑛𝑡𝑒𝑟𝑡/noCre = 8 fish and 𝑛𝑡𝑒𝑟𝑡/+Cre = 8 fish), respectively. Scale bar, 20 µm. All data are presented as the mean ± s.e.m.; *P < 0.05; **P < 0.01, ***P < 0.001, using a one-way ANOVA and post hoc Tukey test; *P < 0.05, using a Kruskal–Wallis test and post hoc Dunn test.

Source data

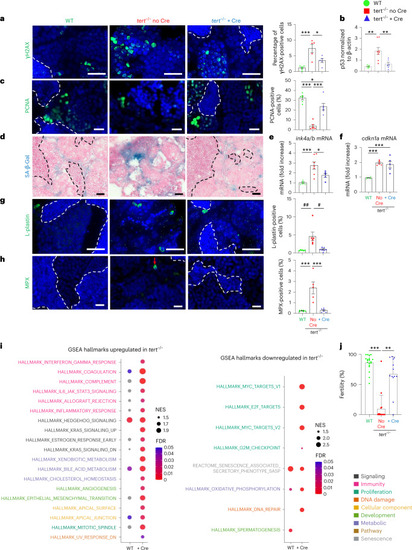
Gut-specific tert expression rescues the aging phenotypes of testes.

ae, Delaying gut aging in tert−/− + Cre fish rescues DNA damage, proliferation and senescence in the testes compared to tert−/ no Cre fish. a, Representative immunofluorescence images of DNA damage staining (γH2AX, left) and quantification (right, nWT = 6, 𝑛𝑡𝑒𝑟𝑡/noCre = 5 and 𝑛𝑡𝑒𝑟𝑡/+Cre = 5 fish) in the tissue of testes. b, Quantification of p53 protein levels (normalized by β-actin) in 9-month-old testes extracts analyzed by western blot (nWT = 6, 𝑛𝑡𝑒𝑟𝑡/noCre = 8 and 𝑛𝑡𝑒𝑟𝑡/+Cre = 8 fish). c, Representative immunofluorescence images of proliferation staining (left, PCNA) and quantification (right, n = 6 fish per group) in the tissue of testes. d, Representative image of SA-β-Gal staining of 9-month-old testes cryosections. e,f, RT–qPCR analysis of the senescence-associated genes ink4a/b (p15/16) (e) and cdkn1a (p21) (f) expression in testes samples (nWT = 6 and 5, 𝑛𝑡𝑒𝑟𝑡/noCre = 7 and 6 and 𝑛𝑡𝑒𝑟𝑡/+Cre = 5 and 5 fish, respectively). g, Representative immunofluorescence images of immune cell staining (left, L-plastin) and quantification (right, nWT = 6, 𝑛𝑡𝑒𝑟𝑡/noCre = 6 and 𝑛𝑡𝑒𝑟𝑡/+Cre = 7 fish) in testes tissues. h, Representative immunofluorescence images of neutrophil staining (left, MPX) and quantification (right, nWT = 6, 𝑛𝑡𝑒𝑟𝑡/noCre = 5 and 𝑛𝑡𝑒𝑟𝑡/+Cre = 6 fish) in the tissue of testes. i, Identification of upregulated (left) or downregulated (right) hallmarks in the testes of tert−/− no Cre fish compared to either WT or tert−/− + Cre, based on GSEA. The NES depict to what degree the pathway’s genes are overrepresented in WT or tert−/− + Cre, compared to tert−/− no Cre fish. j, Quantification of male fertility of fish determined by counting the percentage of fertilized eggs (detected by successful embryogenesis events) after individually crossing 9-month-old males with a young (3–6-month-old) WT female (nWT = 19, 𝑛𝑡𝑒𝑟𝑡/noCre = 16 and 𝑛𝑡𝑒𝑟𝑡/+Cre = 13 fish). All analyses were done on sections of 9-month-old fish testes or extracts. Scale bar, 20 µm. The dashed lines delineate the area of mature spermatids. All data are presented as the mean ± s.e.m. *P < 0.05, **P < 0.01, ***P < 0.001, using a one-way ANOVA and post hoc Tukey test; and *P < 0.05, **P < 0.01 using a Kruskal–Wallis and post hoc Dunn test. The RT–qPCR graphs represent the mean ± s.e.m. Note the mRNA fold increase after normalization by rps11 gene expression levels.

Source data

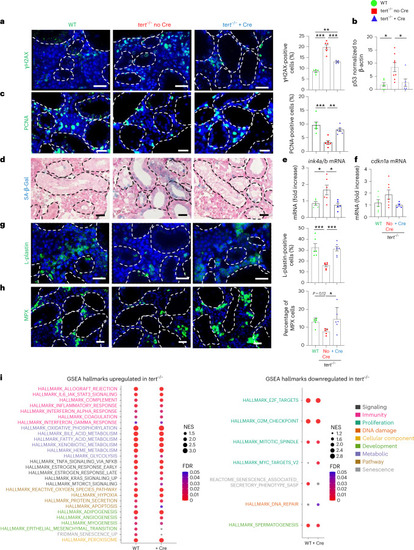
Gut-specific tert expression rescues aging of the hematopoietic system (kidney marrow).

af, Delaying gut aging in tert−/− + Cre fish rescues DNA damage, proliferation and senescence in the kidney marrow when compared to tert−/− no Cre fish. a, Representative immunofluorescence images of DNA damage staining (left, γH2AX) and quantification (right, nWT = 5, 𝑛𝑡𝑒𝑟𝑡/noCre = 6 and 𝑛𝑡𝑒𝑟𝑡/+Cre = 5 fish) in 9-month-old kidney marrow tissues. b, Quantification of p53 protein levels in 9-month-old kidney extracts analyzed by western blot (nWT = 6, 𝑛𝑡𝑒𝑟𝑡/noCre = 8 and 𝑛𝑡𝑒𝑟𝑡/+Cre = 6 fish). c, Representative immunofluorescence images of proliferation staining (left, PCNA) and quantification (right, n = 6 fish per group) in 9-month-old kidney marrow tissues. d, Representative images of SA-β-Gal staining of 9-month-old kidney marrow cryosections. e,f, RT–qPCR analysis of senescence-associated genes ink4a/b (p15/16) (nWT = 5, 𝑛𝑡𝑒𝑟𝑡/noCre = 6 and 𝑛𝑡𝑒𝑟𝑡/+Cre = 5 fish) (e) and cdkn1a (p21) (nWT = 6, 𝑛𝑡𝑒𝑟𝑡/noCre = 7 and 𝑛𝑡𝑒𝑟𝑡/+Cre = 4 fish) (f) expression in 9-month-old kidney marrow samples. gi, tert mRNA expression in the gut of tert−/− fish (tert−/− + Cre fish) have beneficial hematopoietic effects by reducing kidney marrow inflammation and increasing immune compartment compared to tert−/− no Cre fish. g, Representative immunofluorescence images of immune cell staining (left, L-plastin) and quantification (right, nWT = 6, 𝑛𝑡𝑒𝑟𝑡/noCre = 6 and 𝑛𝑡𝑒𝑟𝑡/+Cre = 7 fish) in the tissue of 9-month-old testes. h, Representative immunofluorescence images of neutrophil staining (left, MPX) and quantification (right, nWT = 6, 𝑛𝑡𝑒𝑟𝑡/noCre = 5 and 𝑛𝑡𝑒𝑟𝑡/+Cre = 6 fish) in the tissue of 9-month-old kidney marrow. i, Identification of upregulated (left) or downregulated (right) hallmarks in the kidney marrow of tert−/− no Cre compared to either WT or tert−/− + Cre fish based on GSEA. The NES depicts to what degree the pathway genes are overrepresented in WT or tert−/− + Cre, compared to tert−/− no Cre fish. Scale bar, 20 µm. The dashed lines delineate the kidney tubules. All data are presented as the mean ± s.e.m. (*P < 0.05; **P < 0.01, ***P < 0.001, using a one-way ANOVA and post hoc Tukey test). The western blot graphs represent the mean ± s.e.m. of p53 normalized by β-actin band intensities. All RT–qPCR graphs represent the mean ± s.e.m. mRNA fold increase after normalization by rps11 gene expression levels.

Source data

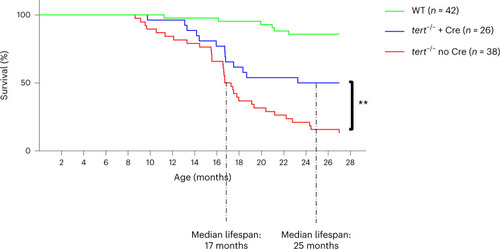
Gut-specific tert expression extends the lifespan of tert−/− zebrafish.

Gut-specific telomerase activity extends the lifespan, increasing median life from 17 months in tert−/− no Cre fish to 24 months in tert−/− + Cre fish. The survival curve of WT (n = 42 fish), tert−/− no Cre (n = 38 fish) and tert−/− + Cre (n = 26 fish) zebrafish (**P < 0.01 using the log-rank test) is shown.

Source data

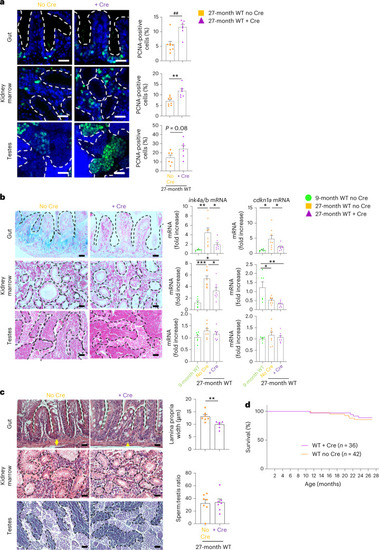
Gut-specific tert expression extends the healthspan of naturally aged zebrafish.

Expression of tert transgene in the gut of WT fish delays local aging phenotypes such as proliferation, senescence and tissue degeneration. This leads to beneficial systemic impact improving early aging phenotypes such as proliferation capacity. a, Representative immunofluorescence images of proliferation staining (left, PCNA) and quantification (right) in the gut, testes and kidney marrow of 27-month-old WT zebrafish expressing (WT + Cre; n = 7 fish for the gut and kidney marrow and n = 6 fish for the testes) or not expressing (WT no Cre; n = 8 fish for the gut and kidney marrow and n = 6 fish for the testes) tert transgene in the gut. b, Representative images of SA-β-Gal staining of gut, testes and kidney marrow sections of 24-month-old WT zebrafish expressing (WT + Cre) or not expressing (WT no Cre) the tert transgene in the gut (left). RT–qPCR analysis of senescence-associated genes ink4a/b (p15/16) and cdkn1a (p21) in the gut, testes and kidney marrow of either 9- (n = 6 fish) or 27-month-old WT zebrafish expressing (WT + Cre; n = 8 fish) or not expressing (WT no Cre; n = 8 fish) tert mRNA in the gut (right). c, Representative H&E-stained sections of the gut, testes and kidney marrow of 27-month-old WT zebrafish expressing (WT + Cre) or not expressing (WT no Cre) the tert transgene in the gut (left) and respective quantifications of the width of the gut lamina propria (right; n = 7 fish for WT no Cre and n = 6 fish for WT + Cre) and mature spermatid area (right; n = 7 fish for WT no Cre and WT + Cre). The yellow arrows indicate the width of the lamina propria quantified on the left. The dashed lines delineate the mature area of the spermatids. d, Survival curve of WT no Cre (n = 42 fish; similar to the WT curve in Fig. Fig.7)7) and WT + Cre (n = 36 fish) zebrafish. All data are presented as the mean ± s.e.m. *P < 0.05, **P < 0.01, ***P < 0.001, using a two-tailed unpaired t-test for a,c or a one-way ANOVA and post hoc Tukey tests for b; **P < 0.01, a using two-tailed Mann–Whitney U-test). All RT–qPCR graphs represent the mean ± s.e.m. mRNA fold increase after normalization by rps11 gene expression levels. Scale bar, 20 µm.

Source data

Acknowledgments
This image is the copyrighted work of the attributed author or publisher, and ZFIN has permission only to display this image to its users. Additional permissions should be obtained from the applicable author or publisher of the image. Full text @ Nat Aging