Figure Caption
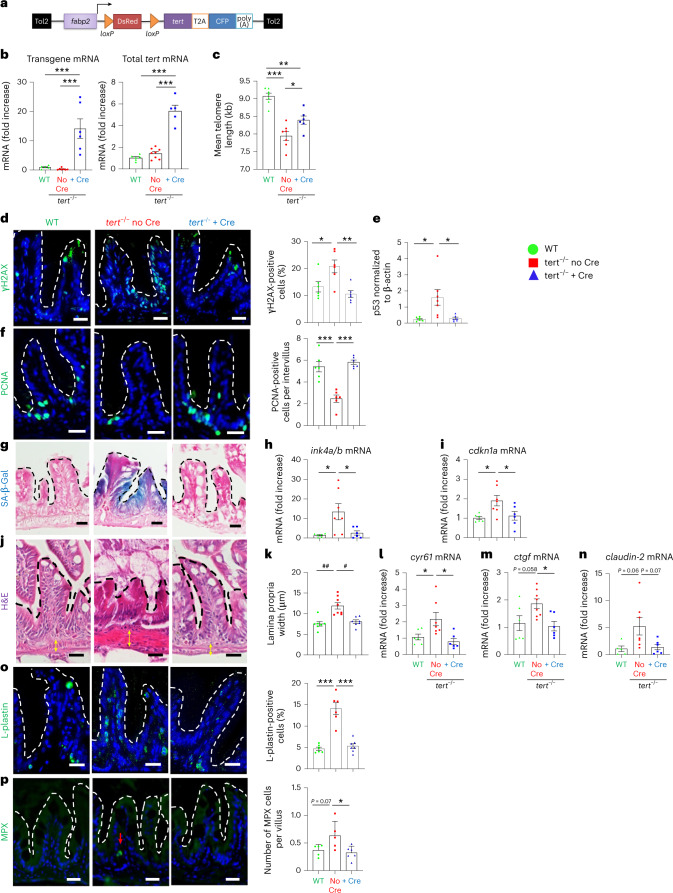
Gut-specific and Cre-mediated tert expression rescues gut aging phenotypes.a, Schematic representation of the transgene for Cre-inducible and tissue-specific expression of tert mRNA. b, RT–qPCR analysis of tert transgene mRNA and total tert mRNA (endogenous + transgene) expression in 9-month-old gut extracts (nWT = 5 and 6; 𝑛𝑡𝑒𝑟𝑡−/−noCre = 7 and 8 and 𝑛𝑡𝑒𝑟𝑡−/−+Cre = 6 and 5 fish, respectively; levels were normalized by rps11 gene expression levels). c, Quantification of mean telomere length by TRF analysis (nWT = 7; 𝑛𝑡𝑒𝑟𝑡−/−noCre = 7 and 𝑛𝑡𝑒𝑟𝑡−/−+Cre = 6 fish). d, Representative immunofluorescence images of DNA damage staining (γH2AX; left) and quantification (right; nWT = 6; 𝑁𝑡𝑒𝑟𝑡−/−noCre = 6 and 𝑛𝑡𝑒𝑟𝑡−/−+Cre = 6 fish). e, Quantification of p53 protein levels (normalized by β-actin) analyzed by western blot (nWT = 6; 𝑁𝑡𝑒𝑟𝑡−/−noCre = 7 and 𝑛𝑡𝑒𝑟𝑡−/−+Cre = 6 fish). f, Representative immunofluorescence images of proliferation staining (left, proliferation cell nuclear antigen (PCNA)) and quantification (right, nWT = 6; 𝑛𝑡𝑒𝑟𝑡−/−noCre = 6 and 𝑛𝑡𝑒𝑟𝑡−/−+Cre = 6 fish). g, Representative image of SA-β-Gal staining. h,i, RT–qPCR analysis of the senescence-associated genes ink4a/b (p15/16) (h) and cdkn1a (p21) (i) expression (nWT = 6; 𝑛𝑡𝑒𝑟𝑡−/−noCre = 7 and 𝑛𝑡𝑒𝑟𝑡−/−+Cre = 6 fish). j,k, Representative hematoxylin and eosin (H&E)-stained sections of the gut (j). The yellow arrows delineate the lamina propria width quantified in k (nWT = 7; 𝑛𝑡𝑒𝑟𝑡−/−noCre = 8 and 𝑛𝑡𝑒𝑟𝑡−/−+Cre = 7 fish). l,m, RT–qPCR analysis of the YAP target genes cyr61 (l) and ctgf expression (m) (nWT = 6; 𝑛𝑡𝑒𝑟𝑡−/−noCre = 8 and 𝑛𝑡𝑒𝑟𝑡−/−+Cre = 6 fish). n, RT–qPCR analysis of the junction protein-associated gene claudin-2 expression (nWT = 5; 𝑛𝑡𝑒𝑟𝑡−/−noCre = 7 and 𝑛𝑡𝑒𝑟𝑡−/−+Cre = 6 fish). o, Representative immunofluorescence images of immune cell staining (left, L-plastin) and quantification (right, nWT = 6 fish; 𝑛𝑡𝑒𝑟𝑡−/−noCre = 6 fish and 𝑛𝑡𝑒𝑟𝑡−/−+Cre = 7 fish). p, Representative immunofluorescence images of neutrophil staining (left, myeloperoxidase (MPX)) and quantification (right, nWT = 5 fish; 𝑛𝑡𝑒𝑟𝑡−/−noCre = 5 fish and 𝑛𝑡𝑒𝑟𝑡−/−+Cre = 6 fish). All analyses are based on 9-month-old fish gut sections or extracts. Scale bar, 20 µm. The dashed lines delineate the gut villi. All data are presented as the mean ± s.e.m. *P < 0.05, **P < 0.01, ***P < 0.001, using a one-way ANOVA and post hoc Tukey test; *P < 0.05, **P < 0.01, using a Kruskal–Wallis and post hoc Dunn test.
Source data