
- Title
-
Slow myosin heavy chain 1 is required for slow myofibril and muscle fibre growth but not for myofibril initiation
- Authors
- Hau, H.A., Kelu, J.J., Ochala, J., Hughes, S.M.
- Source
- Full text @ Dev. Biol.
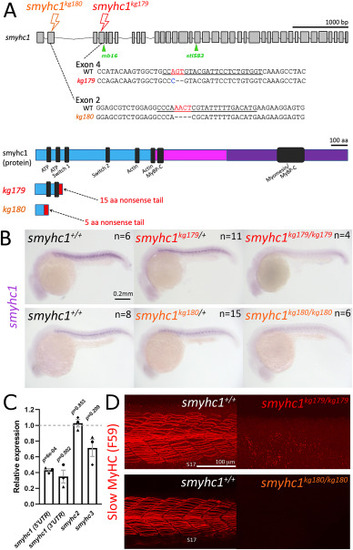
Genome editing generates likely null alleles of zebrafish smyhc1. (A) Schematic of smyhc1 gene, mRNA sequences and proteins showing nature of smyhc1kg179 and smyhc1kg180 mutant alleles. Underline indicates the guide RNA sequence, red and blue bases were deleted and inserted, respectively. Most of the S1 (cyan) and all the S2 (magenta) and LMM domains (purple) of the protein are lost in the mutants, ablating most highly-conserved regions (black). Location of other smyhc1mb16-18 and smyhc1stl583 truncation alleles are marked (green). (B) In situ RNA hybridisation for smyhc1 mRNA in smyhc1 mutant and their siblings from smyhc1kg179/+ and smyhc1kg180/+ in-crosses reveal nonsense-mediated decay of mutant smyhc1kg179 and smyhc1kg180 mRNA at 24 hpf. In a randomly-selected sample from a smyhc1kg179/+ incross, 4/21 had reduced expression and were shown to be mutant; among 17 ‘normal’ expressors 11/20 were heterozygotes and 6/20 were wild type upon sequence genotyping. From the smyhc1kg180/+ incross, 6/29 embryos had low expression and were shown to be mutant; among 23 normal expressors 15/23 were heterozygous and 8/23 were wild type upon sequence genotyping. (C) Quantitative RT-PCR for smyhc1, smyhc2 and smyhc3 on pools of ten 2 dpf embryos from a smyhc1kg179/+ incross that had been sorted into immotile mutant and motile siblings at 1 dpf. Each symbol represents a separate reverse transcription with symbol shapes distinguishing biological replicate lays from separate parents. The dashed line represents the motile sibling level (D). Maximum intensity projections of Slow MyHC-stained 24 hpf embryos showing region centred on somite 17 (S17). Wild-type siblings (left) show slow fibre staining and smyhc1kg179/kg179 and smyhc1kg180/kg180.mutant siblings show no slow fibre stain (right). |
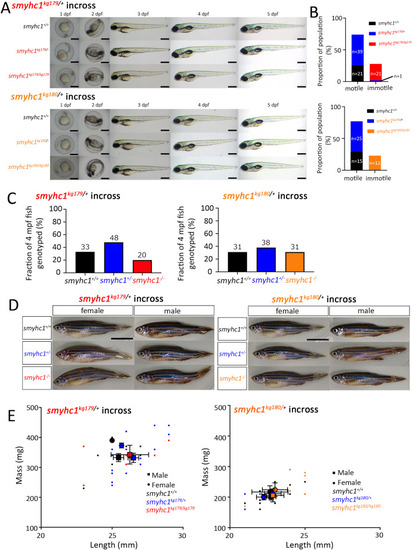
Zygotic smyhc1 mutation reduces embryo motility but survive to adulthood. A) Representative bright-field images of 1,2,3,4 and 5 dpf larvae from smyhc1kg179/+ and smyhc1kg180/+ heterozygote in-crosses. Fish are shown anterior towards the left and dorsal upwards with genotyped heterozygotes and mutants below their respective wild type siblings. Scale bars = 0.5 mm. B) Randomly selected larvae were dechorionated at 24 hpf and examined for presence or absence of tail coiling movement in smyhc1kg179/+ in-cross (n = 82) and in smyhc1kg180/+ in-cross (n = 52). The genotype of the fish was determined after the examination by DNA sequencing. Fish derived from several in-crosses of smyhc1kg179/+ (n = 101) and smyhc1kg180/+ (n = 100) fish were reared with their siblings and genotyped at 4 months post-fertilization (mpf). C) Adults showed the expected Mendelian ratios at 4 mpf. Fish numbers above each bar. D) Adults at 12 mpf. Scale bars = 1 cm. E) Length and mass at 4 mpf of genotyped siblings showed no significant difference between genotypes. Small symbols indicate individuals, large symbols the mean for each sex and genotype ± S.E.M. Overall length and weight were less in adult fish from the smyhc1kg180/+ lay compared to adult fish from the smyhc1kg179/+ lay, a difference that may reflect an uncontrolled environmental or genetic background effect. |
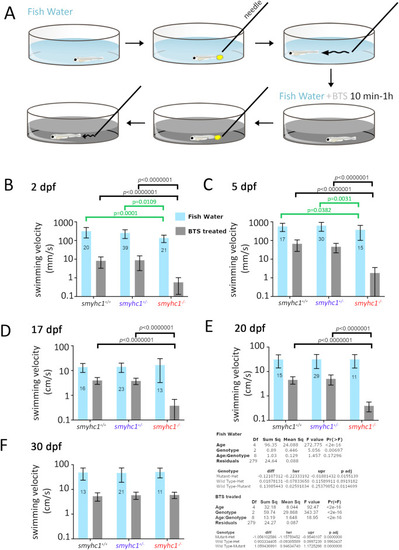
Loss of Smyhc1 reduces swimming velocity. Zebrafish larvae from smyhc1kg179/+ in-crosses in fish water were assayed for swimming activity upon touch stimulation with a pipette before and then after transient treatment with 50 μM fast myosin inhibitor BTS. A) Schematic describing workflow. B–F) Quantification of velocity (mean ± SD, N = indicated on bars) on fish of indicated ages were obtained using at least three separate lays from heterozygous smyhc1kg179/+ in-crosses. Full dataset is in Table S1. Note the log10 scale on the Y-axes to show both control Fish Water and BTS-treated data accurately. Summary Tukey post hoc statistics for separate two way ANOVAs on Fish Water and BTS-treated are shown below. In each case, the upper table shows the overall significance, whereas the lower table shows the Tukey post hoc significance levels for the overall effects of genotype independent of age. Values of within-age Tukey post hoc test comparisons are indicated above graphs (black lines and p-values), none of which had p < 0.05 in Fish Water. To mitigate the effect of changing variance due to the increase in velocity with age and large effect of BTS, individual one way ANOVAs on genotype were performed at each age and Tukey post hoc tests supported the reduced velocity of mutants in Fish Water at 2 and 5 dpf only (green lines and p-values). PHENOTYPE:
|
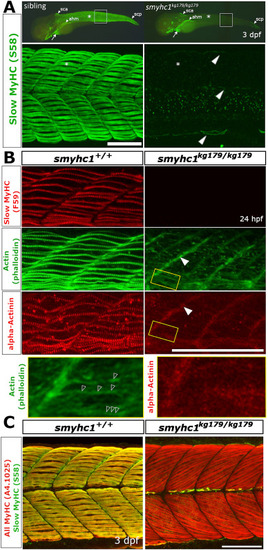
Defective sarcomere organisation in smyhc1kg179/kg179 mutants. Sibling zebrafish from smyhc1kg179/+ in-crosses mounted dorsal up, anterior to left, shown in wholemount (A, upper panel) or maximal intentisity projection confocal stacks. A) Slow MyHC immunofluorescent detection with antibody S58 at 3 dpf shows signal in superficial slow fibres (SSFs) of heterozygote sibling (n = 8/8 sibs) but its absence in mutant (asterisks), despite the presence in mutant of signal in cranial, cardiac (arrows), and specific somite-derived muscle (arrowheads; n = 6/6). White boxes are shown enlarged beneath to highlight S58 signal in thin nascent SSFs at dorsal and ventral somitic extremes and muscle pioneers at the horizontal myoseptum in mutant (arrowheads). B) Immunodetection of slow MyHC with antibody F59 and α-actinin to mark Z-disks and phalloidin staining to reveal filamentous actin in somite 17/18 region at 24 hpf. Note the absence of organised Z-lines and thin filament arrays in the mutant but the persistence of signal at the verticle myoseptum (filled arrowheads). Boxed areas magnified beneath show repeated F-actin structures in mutant (open arrowheads) that appear to lack α-actinin. C) Immunodetection of slow MyHC with antibody S58 and all sarcomeric MyHC with A4.1025 reveals lack MyHC in mutant slow fibres but presence in underlying fast fibres in somite 16–19 region at 3 dpf. Note the poor binding of A4.1025 to fast fibres in the wild type, presumably due to adsorption to slow fibres. Abbreviations: ahm – anterior hypaxial muscle, sca - supracranialis anterior, scp - supracranialis posterior. Bars = 100 μm. EXPRESSION / LABELING:
PHENOTYPE:
|
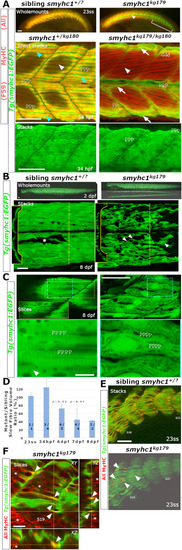
Survival of SSFs without Smyhc1. Sibling zebrafish from smyhc1kg179/+;Tg(smyhc1:EGFP)i104 male crossed to a female smyhc1kg180/kg180 or smyhc1kg179/+;Tg(smyhc1:EGFP)i104 mounted dorsal up, anterior to left, shown in live wholemount or confocal maximal intensity projection stacks or slices. A) Upper panels: 23ss embryos stained for sarcomeric MyHC revealing absence of signal in slow fibres marked by GFP in mutant. Note the absence of MyHC in muscle pioneers (arrowhead) and slow fibres in tail regions lacking fast MyHC (bracket). Middle panels: Short stacks of somite 19/20 stained for MyHC with F59 showing the presence of a layer of SSFs marked by EGFP (arrows) in both mutant and sibling at 34 hpf. Note the coincidence of strong slow MyHC and EGFP in SSFs (cyan arrowheads) only in the sibling. Dark areas reflect regions of the stack containing underlying fast fibres. The short stack in the mutant was selected to show that MyHC is also weakly detected by F59 in obliquely-orientated fast fibres (white arrowheads). EGFP signal in SSFs of mutant reveals a striated sarcomere-like pattern despite the absence of MyHC (open arrowheads). Lower panels: Magnified full stacks of the same embryos show EGFP in dorsal myotomes of somites 18–20 revealing normal SSF orientation, nuclear positioning and striation (open arrowheads) in mutant. B) Live smyhc1kg179;Tg(smyhc1:EGFP) mutant and sibling embryos/larvae. Upper panels: Lateral views, with dorsal view below, showing that all SSFs have migrated to the lateral myotome in a 2 dpf mutant. Lower panels: Live 8 dpf larval somites 17–19 showing migrated mutant SSFs detached from the vertical myosepta (arrowheads), compared with a rare fibre defect in the SSF layer in sibling (asterisk). Insets show reduced volume of mutant SSFs in transverse optical sections at the dashed lines. C) Single confocal slices of EGFP in SSF layers with blue boxes magnified below. Whereas the sibling had cytoplasm largely filled with myofibrils containing a regular 1.96 μm sarcomeric array (open arrowheads), the mutant showed prominent nuclei, a thin disorganized cytoplasm filled with vacuoles between which ran immature and poorly-aligned material with closer striations (open arrowheads). Some fibre regions in sibling were devoid of myofibrils (arrowhead) and contained prominent and extensive vacuoles (Inset yellow box is a slice 5 μm more superficial to the dashed yellow box region displaying the abundant vacuolar structures at the myotome surface that are less apparent deeper within the SSF layer. D) Quantification of gradually reduced EGFP cell volume of SSFs in smyhc1kg179;Tg(smyhc1:EGFP) mutants compared to their siblings at the same age. Mean (± SEM when N allowed, calculated by to include propagation of error in both sibling and mutant measures) of the proportion for scanned segment of at least three somites centred on somite 18. On each column, fraction is number of mutant/sibling fish analysed with identical scan and post-processing parameters. Thus, at 1–2 dpf four embryos had SSFs of similar volume to those in five of their non-mutant siblings whereas, at 6–8 dpf, nine mutant larvae had SSFs about half the size of those in 11 non-mutant siblings. P-values above columns represent t-test on measured volumes of mutants versus siblings at each age. E,F). Confocal stacks (E) and slices (F) of 2 h-old somites at 23ss showing the emergence of small MyHC-containing myofibrils in mutant SSFs (arrowheads). Crosshairs in F indicate slice planes. Asterisks mark the initiation of deep fast MyHC accumulation in more anterior somites. Bars 50 μm (A,B,C upper, E) and 10 μm (C lower, F). EXPRESSION / LABELING:
PHENOTYPE:
|
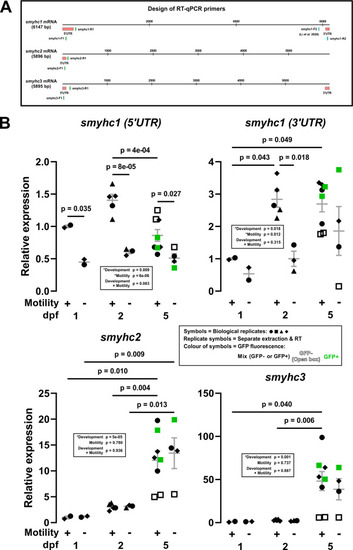
Nonsense-mediated decay of smyhc1 mRNA and lack of compensatory upregulation by smyhc2 or smyhc3 mRNAs. (A) Schematic showing the design of RT-qPCR primers for smyhc1-3 transcripts. To ensure specificity, primer sets were designed to target the 5′ or 3′ untranslated region (UTR) of the transcripts. (B) Expression of smyhc1-3 at 1, 2 and 5 dpf in siblings from smyhc1kg179/+;Tg(smyhc1:EGFP)i104/+ in-crosses that had been sorted at 1 dpf into motile and immotile groups. Total RNA prepared from 5 or 10 embryos/larvae per sample from two to four independent lays (represented by symbol shape). Some embryos/larvae were further sorted based on EGFP fluorescence (represented by symbol colour). Bars show mean ± SEM of all samples. Statistics are two-way ANOVA (Stage/Motility) with Bonferroni's post hoc test. |
Reprinted from Developmental Biology, 499, Hau, H.A., Kelu, J.J., Ochala, J., Hughes, S.M., Slow myosin heavy chain 1 is required for slow myofibril and muscle fibre growth but not for myofibril initiation, 47-58, Copyright (2023) with permission from Elsevier. Full text @ Dev. Biol.