
- Title
-
AMFR dysfunction causes autosomal recessive spastic paraplegia in human that is amenable to statin treatment in a preclinical model
- Authors
- Deng, R., Medico-Salsench, E., Nikoncuk, A., Ramakrishnan, R., Lanko, K., Kühn, N.A., van der Linde, H.C., Lor-Zade, S., Albuainain, F., Shi, Y., Yousefi, S., Capo, I., van den Herik, E.M., van Slegtenhorst, M., van Minkelen, R., Geeven, G., Mulder, M.T., Ruijter, G.J.G., Lütjohann, D., Jacobs, E.H., Houlden, H., Pagnamenta, A.T., Metcalfe, K., Jackson, A., Banka, S., De Simone, L., Schwaede, A., Kuntz, N., Palculict, T.B., Abbas, S., Umair, M., AlMuhaizea, M., Colak, D., AlQudairy, H., Alsagob, M., Pereira, C., Trunzo, R., Karageorgou, V., Bertoli-Avella, A.M., Bauer, P., Bouman, A., Hoefsloot, L.H., van Ham, T.J., Issa, M., Zaki, M.S., Gleeson, J.G., Willemsen, R., Kaya, N., Arold, S.T., Maroofian, R., Sanderson, L.E., Barakat, T.S.
- Source
- Full text @ Acta Neuropathol.
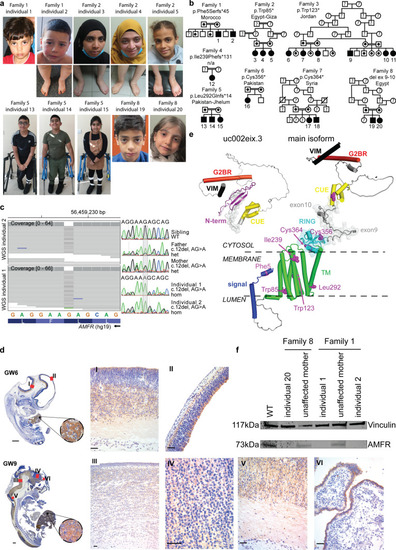
Homozygous |
|
Patient-derived fibroblasts with |
|
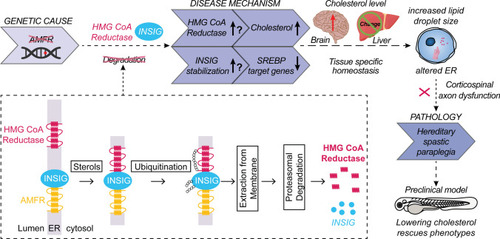
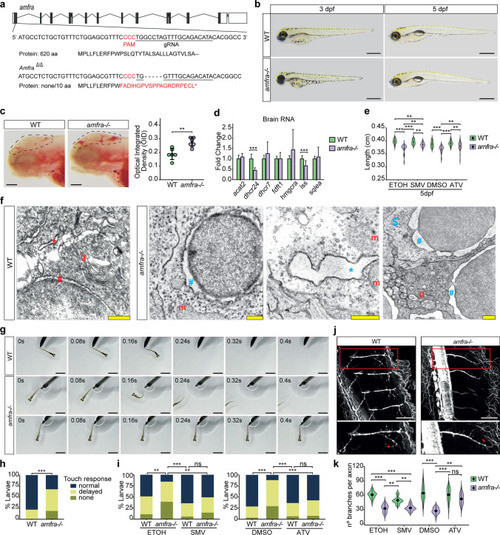
Hypothetical model describing the processes leading to HSP upon AMFR dysfunction. Upon loss of function of AMFR, degradation of HMGCR and INSIG proteins is likely blunted, resulting in an increased cholesterol synthesis rate upon HMGCR stabilization and a compensatory repression of SREBP processing causing reduced expression of lipogenic SREBP target genes upon stabilizing of INSIG proteins. The net effect of these opposing lipogenic and non-lipogenic processes is a disturbance in the balance of lipid and cholesterol homeostasis which is reflected by increased lipid droplet size in patient-derived fibroblasts and in human neural stem cells in the absence of AMFR. Possibly, cell-type-specific and species-specific differences in the balance between both opposite processes might occur, explaining the absence of increased cholesterol levels in patient serum and contradictory results in |

ZFIN is incorporating published figure images and captions as part of an ongoing project. Figures from some publications have not yet been curated, or are not available for display because of copyright restrictions. PHENOTYPE:
|
|
ZFIN is incorporating published figure images and captions as part of an ongoing project. Figures from some publications have not yet been curated, or are not available for display because of copyright restrictions. PHENOTYPE:
|