
- Title
-
Multimodal 4-arylchromene derivatives with microtubule-destabilizing, anti-angiogenic, and MYB-inhibitory activities
- Authors
- Köhler, L.H.F., Reich, S., Yusenko, M., Klempnauer, K.H., Begemann, G., Schobert, R., Biersack, B.
- Source
- Full text @ Cancer Drug Resist
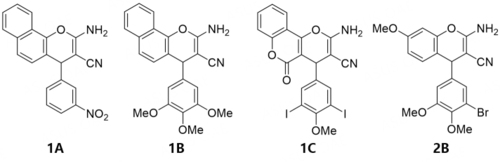
Structures of LY290181 (1A); MYB inhibitor Bcr-TMP (1B); chromosomal de-clustering agent 1C; and antiproliferative compound 2B. |
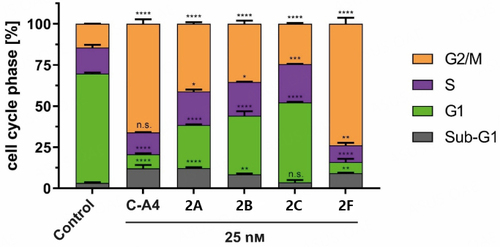
Cell cycle events of 518A2 melanoma cells treated with 2A-C and 2F (25 nM) for 24 h. Positive control (C-A4) and solvent (DMSO) were treated similarly to the substances. Measurements were carried out in triplicate and expressed as means ± SD with GraphPad Prism. Significance is expressed as n.s. |

Immunofluorescence images of 518A2 melanoma cells treated with compounds 2A-C; 2F; and CA4 (100 nM) or vehicle (DMSO) for 0.5, 1, 3, and 6 h. Representative images (of two experiments) illustrate stained microtubules (white) and nuclei (blue). The scale bar corresponds to 100 µm, magnification of 630×. |

Intracellular localization of 3 (25 µM) using melanoma cells (518A2) after 10 min. The uptake was visualized using a Cu(I)-catalyzed reaction with 3-azido-7-hydroxycoumarin (white), and the nuclei were counterstained (Nuclear Green, blue). The right image shows the magnified section marked with a white box. The experiment was carried out in duplicate. The scale bar corresponds to 100 µm (left) or 25 µm (right), magnification of 630×. |

Images show EA.hy926 cells seeded on Matrigel® after 4 h treatment with substances 2A-C; 2F (25, 100 nM); and C-A4 (25 nM) or vehicle (DMSO). Representative images of a min. of two experiments. The scale bar corresponds to 500 µm, magnification of 100×. |
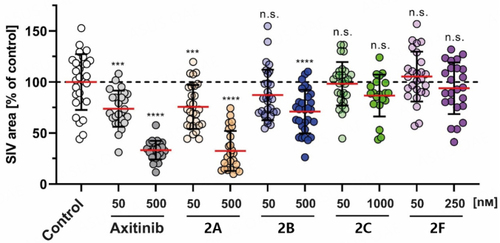
Effects of 2A; 2B (50, 500 nM); 2C (50, 1000 nM); and 2F (50, 250 nM) on the SIV growth of zebrafish larvae (24 hpf) after treatment (48 h). Positive controls used axitinib (50, 500 nM). Negative controls used equivalent amounts of DMSO. The SIV area was quantified using ImageJ and expressed as mean ± SD of at least 20 zebrafish. The significance is expressed as n.s. |

Inhibition of MYB activity in HEK-293 cells containing the reporter plasmid pGL4-5xMRE(GG)-Myc and the expression vector for MYB-2KR, upon treatment with compounds 1B; 2A-C; and 2F (0.1-100 nM) for 16 h. IC50 values were calculated with at least four independent experiments using GraphPad Prism 9. |