
- Title
-
Dopey2 and Pcdh7 orchestrate the development of embryonic neural stem cells/ progenitors in zebrafish
- Authors
- Xiao, Y., Hu, M., Lin, Q., Zhang, T., Li, S., Shu, L., Song, X., Xu, X., Meng, W., Li, X., Xu, H., Mo, X.
- Source
- Full text @ iScience
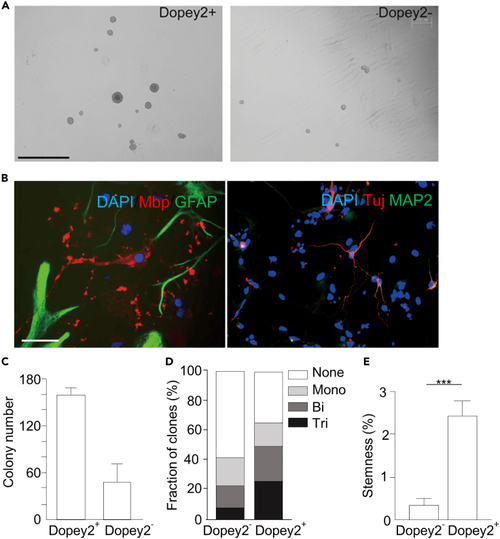
Dopey2+ cells exhibit higher stemness capacity (A) Fluorescence-activated cell sorted Dopey2+ and Dopey2- NSCs/neural progenitor cells were seed in semi-solid NSC medium. After 7 days, Dopey2+ NSCs/neural progenitor cells formed larger clones. Scale bar = 1 mm. (B) In NCFC assay, neurospheres cultured as monolayer for differentiation were multi-labeled immunostained for DAPI/Mbp/GFAP and DAPI/Tuj/MAP2. Scale bar = 50 μm. (C) Colony number of Dopey2+ and Dopey2- neuroshperes (means ± SEM; n = 3). (D) Neurospheres were measured and grouped. Tripotential clone: differentiating into three types of neural cells; bipotential clone: differentiating into either two cell types; monopotential clone: differentiating into one cell type. (E) Stemness calculated by dividing the number of forming tripotential clones by total cells. Student’s t test: ∗∗∗p < 0.001 indicates a significant increase when Dopey2+ group compared with Dopey2- group. |
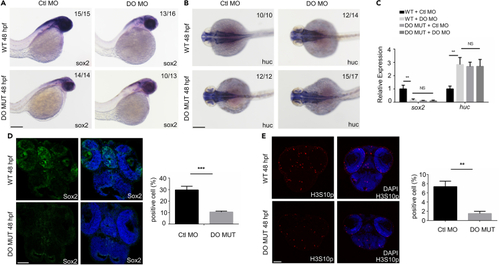
Dopey2 modulates the proliferation of neural stem cells/progenitors and inhibits the differentiation of neural stem cells/progenitors in zebrafish embryonic brains (A and B) In situ hybridization analysis showed the expression of sox2, huc genes. Embryos were analyzed at 48 hpf (hour postfertilization). WT or DO MO embryos were pre-injected with Ctl MO or DO MO. Scale bar = 200 μm. (C) Real-time fluorescence quantitative PCR analysis showed the relative expression level of sox2, huc genes in embryos at 48 hpf, WT or DO MO embryos were pre-injected with Ctl MO or DO MO (mean ± s.e.m, n = 3, Student’s t test: ∗∗∗p < 0.001, ∗∗p < 0.01, ∗p < 0.05, NS = not significant). (D) Representative immunofluorescence staining for Sox2 in frozen sections of 48 hpf WT or DO MUT embryos. Scale bar = 50 μm. Diagram showed quantitative analysis of Sox2 positive cells in WT or DO MUT embryos (mean ± s.e.m, n = 3, Student’s t test: ∗∗∗p < 0.001). Images were quantified by ImageJ software. (E) Representative immunofluorescence staining of H3S10p in the frozen sections of 48 hpf WT or DO MUT embryos. Scale bar = 50 μm. Diagram showed quantitative analysis of H3S10p positive cells in WT or DO MUT embryos (mean ± s.e.m, n = 3, Student’s t test: ∗∗p < 0.01). Images were quantified by ImageJ software. Ctl MO: control MO, DO MO: dopey2 MO, WT: wild type, DO MUT: dopey2mutant. |
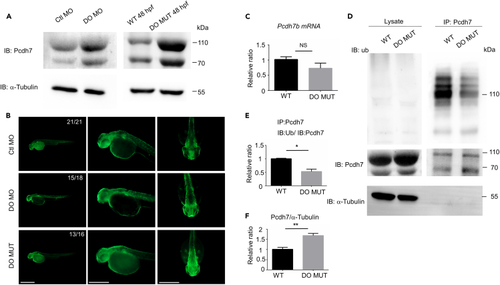
Dopey2 modulates the ubiquitination of Pcdh7b protein (A) Left panel illustrates immunoblotting detected Pcdh7 protein levels in 48 hpf WT embryos pre-injected with Ctl MO or DO MO; right panel illustrates immunoblotting detected Pcdh7 protein levels in 48 hpf WT or DO MUT embryos. Immunoblotting of α-tubulin was used as loading control. (B) Whole-mount immunofluorescence staining detected Pcdh7 protein in Ctl MO or DO MO injected WT embryos and DO MO embryos at 48 hpf. Scale bar = 500 μm. (C) Real-time fluorescence quantitative PCR analysis detected relative expression level of pcdh7b in WT or DO MUT embryos. (mean ± s.e.m, n = 3, Student’s t test: NS = not significant). (D) Co-immunoprecipitation (co-IP) analysis detected the ubiquitination of Pcdh7 in 48 hpf WT or DO MUT embryos. IP: immunoprecipitation, IB: immunoblot, Ub: anti ubiquitin antibody. (E) Quantification of immunoprecipitated Pcdh7 (DO MUT embryos) indicated a reduction in ubiquitination (mean ± s.e.m, n = 3, Student’s t test: ∗p < 0.05). Images were quantified by ImageJ software. (F) Quantification of immunoprecipitated Pcdh7 (DO MUT embryos) indicated Pcdh7 had an increase at protein level in lysates (mean ± s.e.m, n = 3, Student’s t test: ∗p < 0.05). Images were quantified by ImageJ software. Ctl MO: control MO, DO MO: dopey2 MO, WT: wild type, DO MUT: dopey2mutant. |
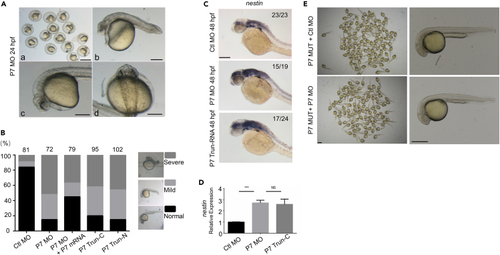
Knocking down pcdh7b caused defects in zebrafish embryos (A) Phenotypes of P7 MO injected zebrafish embryos at 24 hpf. a, Scale bar = 1 mm; b-d, Scale bar = 100 μm. (B) Left panel indicates ratio of phenotypes in each group injected with Ctl MO (2 ng/μL, n = 81), P7 MO (2 ng/μL, n = 72), P7 MO + P7 mRNA (P7 MO 2 ng/μL +P7 mRNA 60 ng/μL, n = 79), P7 TRUN-C (120 ng/μL, n = 93), P7 TRUN-N (120 ng/μL, n = 102). Right panel shows different phenotype of MO injected embryos at 24 hpf. (C) In situ hybridization analysis detected nestin gene in embryos pre-injected with Ctl MO, P7 MO or P7 TRUN-RNA. Scale bar = 200 μm. (D) Real-time fluorescence quantitative PCR analysis showed the relative expression nestin genes in embryos at 48 hpf, embryos were pre-injected with Ctl MO, P7 MO or P7 TRUN-C (mean ± s.e.m, n = 3, Student’s t test: ∗∗∗p < 0.001, NS = not significant). (E) Phenotypes of P7 MUT injected with Ctl MO or P7 MO zebrafish embryos at 24 hpf. Left, Scale bar = 1 mm; Right, Scale bar = 500 μm. Ctl MO: control MO, P7 MO: pcdh7b MO, P7 mRNA: pcdh7b mRNA, P7 TRUN: pcdh7b truncated mRNA. |
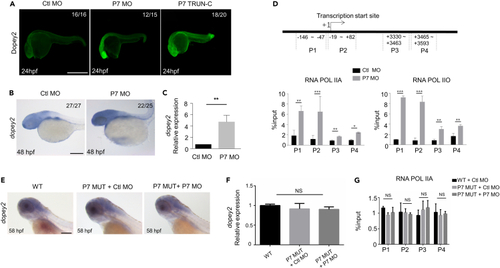
Pcdh7b regulates the transcription of dopey2 in zebrafish embryos (A) Whole-mount immunofluorescence staining detected Dopey2 protein in Ctl MO, P7 MO and P7 TRUN injected embryos at 24 hpf. Scale bar = 500 μm. (B) In situ hybridization analysis detected the expression of dopey2 in 48 hpf embryos pre-inject Ctl MO or P7 MO. Scale bar = 200 μm. (C) Real-time fluorescence quantitative PCR analysis detected the relative expression level of dopey2 gene in 48 hpf embryos pre-injected with Ctl MO or P7 MO (mean ± s.e.m, n = 3, Student’s t test: ∗∗p < 0.01). (D) The top panel represents schematic diagram of dopey2 gene primers for ChIP analysis. The bottom panel showed ChIP analysis results of 48 hpf embryos pre-inject with Ctl MO or P7 MO (mean ± s.e.m, n = 3, Student’s t test: ∗∗∗p < 0.001, ∗∗p < 0.01, ∗p < 0.05). (E) In situ hybridization analysis detected the expression of dopey2 in 58 hpf WT embryos or P7 MUT embryos pre-injected with Ctl MO or P7 MO. Scale bar = 200 μm. (F) Real-time fluorescence quantitative PCR analysis detected the relative expression level of dopey2 gene in 48 hpf WT embryos or P7 MUT embryos pre-injected with P7 MO (mean ± s.e.m, n = 3, Student’s t test: NS = not significant). (G) ChIP analysis results of 48 hpf WT embryos or P7 MUT embryos pre-injected with Ctl MO or P7 MO (mean ± s.e.m, n = 3, Student’s t test: NS = not significant). Ctl MO: control MO, P7 MO: pcdh7b MO, RNA POL IIA: RNA polymerase II with an unphosphorylated CTD, RNA POL IIO: RNA polymerase II with a phosphorylated CTD, WT: wild type, P7 MUT: pcdh7bmutant. |
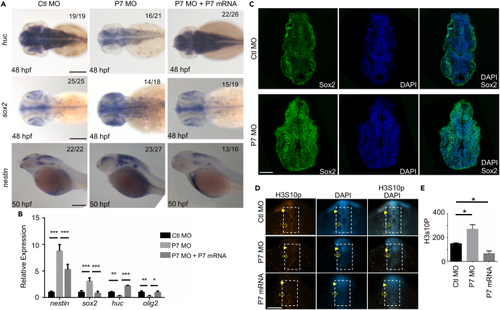
Pcdh7b modulates the differentiation of neural stem cells/progenitors and inhibits the proliferation of neural stem cells/progenitors in zebrafish embryonic brains (A) In situ hybridization analysis detected the expression of nestin, sox2, and huc genes. Emryos were at 48 hpf, 50 hpf, pre-injected with Ctl MO, P7 MO and P7 MO + P7 mRNA. Scale bar = 200 μm. (B) Real-time fluorescence quantitative PCR analysis showed the relative expression level of nestin, sox2, huc and olig2 gene at 48 hpf in embryos pre-injected with Ctl MO, P7 MO and P7 MO + P7 mRNA (mean ± s.e.m, n = 3, Student’s t test: ∗∗∗p < 0.001, ∗∗p < 0.01, ∗p < 0.05). (C) Representative immunofluorescence staining detected Sox2 in the frozen sections of 24 hpf embryos pre-injected with Ctl MO or P7 MO. Scale bar = 50 μm. (D) Whole-mount immunofluorescence staining for H3S10P in Ctl MO, P7 MO and P7 mRNA pre-injected embryos at 24 hpf. Scale bar = 100 μm. (E) Statistical analysis of the number of H3S10P-positive cells in embryos pre-injected with Ctl MO, P7 MO and P7 mRNA. The number in the dotted box region in (A) was counted. For each group, 6 embryos were scored (mean ± s.e.m, n = 3, Student’s t test: ∗p < 0.05). Images were quantified by ImageJ software. Ctl MO: control MO, P7 MO: pcdh7b MO, P7 mRNA: pcdh7b mRNA. |
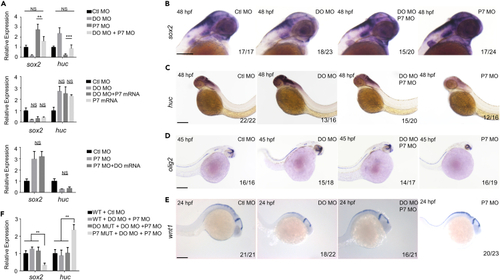
Dopey2 and Pcdh7b complement the development and arrangement of neural cells in zebrafish embryonic brains (A) Real-time fluorescence quantitative PCR analysis shows the relative expression level of sox2, huc at 48 hpf in embryos pre-inject with Ctl MO, DO MO, P7 MO, DO MO + P7 MO, DO MO + P7 mRNA, P7 mRNA, and P7 MO + DO mRNA (mean ± s.e.m, n = 3, Student’s t test: ∗∗∗p < 0.001, ∗∗p < 0.01, ∗p < 0.05). (B–E) ISH analysis of sox2, huc, olig2 and wnt1 for embryos at 48 hpf, 45 hpf and 24 hpf pre-injected with Ctl MO, DO MO, P7 MO and DO MO + P7 MO. Scale bar = 200 μm. (F) Real-time fluorescence quantitative PCR analysis shows the relative expression level of sox2, huc at 48 hpf in WT, DO MUT or P7 MUT embryos pre-inject with Ctl MO, DO MO + P7 MO (mean ± s.e.m, n = 3, Student’s t test: ∗∗p < 0.01). Ctl MO: control MO, DO MO: dopey2 MO, DO mRNA: dopey2 mRNA, P7 MO: pcdh7b MO, P7 mRNA: pcdh7b mRNA, DO MUT: dopey2mutant, P7 MUT: pcdh7bmutant. |
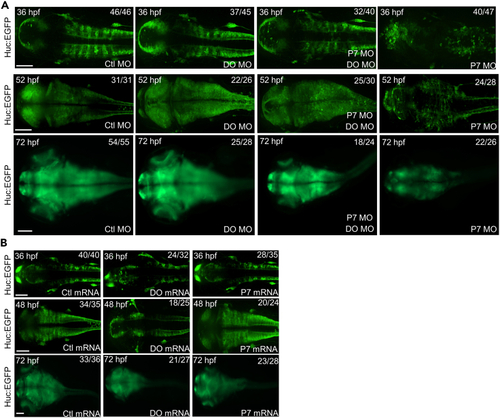
Dopey2 and Pcdh7b orchestrates the development and arrangement of neural cells in zebrafish embryonic brains (A) Embryos of huc:EGFP zebrafish pre-injected with Ctl MO, DO MO, P7 MO and DO MO + P7 MO at 36 hpf, 52 hpf and 72 hpf shows Huc in green fluorescence. Scale bar = 100 μm. (B) Embryos of huc:EGFP zebrafish pre-injected with Ctl mRNA, DO mRNA and P7 mRNA at 36 hpf, 48 hpf and 72 hpf showed Huc in green fluorescence. Scale bar = 100 μm. |