
- Title
-
Transgenic Zebrafish Expressing Rat Cytochrome P450 2E1 (CYP2E1): Augmentation of Acetaminophen-Induced Toxicity in the Liver and Retina
- Authors
- Sato, Y., Dong, W., Nakamura, T., Mizoguchi, N., Nawaji, T., Nishikawa, M., Onaga, T., Ikushiro, S., Kobayashi, M., Teraoka, H.
- Source
- Full text @ Int. J. Mol. Sci.
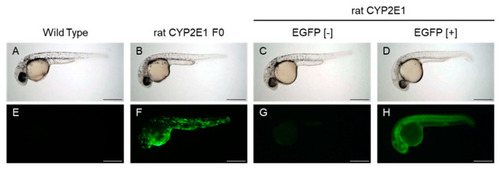
EGFP expression in embryonic zebrafish expressing EGFP and rat CYP2E1. (A–D) are bright field images of 32 hpf embryos showing EGFP fluorescence in the lower row (E–H). (A,E): wild-type embryo. (B,F): pT2A plasmid-injected embryo (rat CYP2E1 F0). (C,D,G,H): transgenic embryo (F2) that was obtained via incross mating between F1 [+/−] adult fish. (C,G): EGFP-negative embryo (EGFP [−]). (D,H): Strongly fluorescent embryos (EGFP [+]). Bar indicates 200 µm. |

Effects of acetaminophen on melanin contents of rat CYP2E1-TG larvae. EGFP fluorescence-negative (EGFP [−]) and -positive (EGFP [+]) F2 CYP2E1-transgenic larvae were exposed to 2.5 mM acetaminophen (APAP) from 24 hpf to 54 hpf for determination of melanin contents. Control means no treatment since APAP was dissolved in ZR solution. Each tube contained 18–20 larvae, and the melanin contents of three tubes were determined for each treatment (n = 3). Bars with different letters (a, b) are significantly different (p < 0.05). Inset images in the right are also shown. Asterisk indicates mild pericardial edema in inset image. |

Acetaminophen-induced reduction in the size of the retina in rat CYP2E1-TG larvae. EGFP fluorescence-negative (EGFP [−]) and -positive (EGFP [+]) F2 CYP2E1-transgenic larvae were exposed to 2.5 mM acetaminophen (APAP) from 24 hpf to 54 hpf for capture of lateral and dorsal images. (A,B,E,F): EGFP [−] larvae. (C,D,G,H): EGFP [+] larvae. (I) indicates quantitative data of lateral area of the retina in the bar graph (n = 10). The retina was circled by white interrupted line for quantification for example (C,D). Scale bar: 200 µm. Bars with different letters in (I), (a, b) are significantly different (p < 0.05). Mild pericardial edema was indicated by arrowhead in D. |

Acetaminophen-induced reduction in the size of the liver in rat CYP2E1-TG larvae and effects of N-acetylcysteine. EGFP fluorescence-negative (EGFP [−]) and -positive (EGFP [+]) F2 CYP2E1-transgenic larvae were exposed to acetaminophen (APAP) from 48 hpf to 96 hpf for capture of lateral images (A-H). The white-dotted circle indicates the liver. (A,B,E,F): EGFP [−] larvae. (C,D,G,H): EGFP [+] larvae. Some larvae were exposed to N-acetylcysteine (NAC) (E,G) and both NAC and APAP at the same time (F,H). (I) indicates averages of areas of the liver in 96 hpf larvae that were exposed to 2.5 mM APAP (2.5 APAP) and/or 20 µM NAC (n = 9 or 10). (J) indicates averages of areas of the liver in 96 hpf larvae that were exposed to 1 mM APAP (1 APAP) (n = 10). Scale bars: 200 µm. Bars with different letters in (I,J) (a, b) are significantly different (p < 0.05). |

Acetaminophen-induced reduction in the size of the expression area of a hepatocyte marker in rat CYP2E1-TG larvae. EGFP fluorescence-negative (EGFP [−]) and -positive (EGFP [+]) F2 rat CYP2E1-transgenic larvae were exposed to 2.5 mM acetaminophen (APAP) from 48 hpf to 96 hpf. The larvae were fixed for whole-mount in situ hybridization with a fabp10a probe, a hepatocyte marker. The white-dotted circle indicates an outline of the liver. (A,B,E,F): EGFP [−] larvae. (C,D,G,H): EGFP [+] larvae. (E–H) are dorsal images of larvae of (A–D), respectively. Scale bar: 200 µm. (I) indicates averages of the expression area from a dorsal view for each treatment (n = 10 or 12). Bars with different letters in I (a, ab, b, c) are significantly different (p < 0.05). |

Effect of acetaminophen on hepatocyte differentiation in rat CYP2E1-TG larvae. EGFP fluorescence-negative (EGFP [−]) (A,C) and -positive (EGFP [+]) (B,D) F2 CYP2E1-transgenic larvae were exposed to 2.5 mM acetaminophen (APAP) from 48 hpf to 54 hpf. The larvae were fixed at 54 hpf for whole-mount in situ hybridization with a foxa3 probe, a marker for the liver primordium. All images (A–D) are of a dorsal view, and black arrows indicate the expression area of foxa3. Scale bars: 200 µm. Panel (E) indicates averaged areas of foxa3 expression (n = 5–9). The “a” over each bar indicates that these values are not statistically different. |