
- Title
-
Transcriptomic and Metabolomic Studies Reveal That Toll-like Receptor 2 Has a Role in Glucose-Related Metabolism in Unchallenged Zebrafish Larvae (Danio rerio)
- Authors
- Hu, W., Liu, L., Forn-Cuní, G., Ding, Y., Alia, A., Spaink, H.P.
- Source
- Full text @ Biology (Basel)
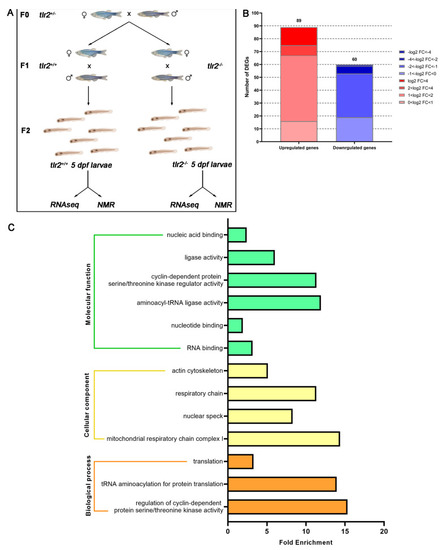
Experimental setup scheme and overview of the RNAseq in tlr2 mutant zebrafish larvae. (A) Setup of the RNAseq and 1H NMR experiment. (B) Overview of the distribution of differentially expressed genes (DEGs) log2 fold change in tlr2−/− versus tlr2+/+ zebrafish larvae. DEGs were assessed by S value ≤ 0.005. Upregulated gene sets are shown in red, and downregulated gene sets are shown in blue. The intensity of color represents the log2 fold change level. (C) Gene ontology (GO) analysis. Significantly enriched GO terms for DEGs of tlr2−/− versus tlr2+/+ groups were determined by using the hypergeometric test/Fisher’s exact test, with a threshold of p value < 0.05 which were adjusted using the Benjamini and Hochbery FDR correction. Genes were categorized according to specific molecular functions, cellular components, and biological processes. |
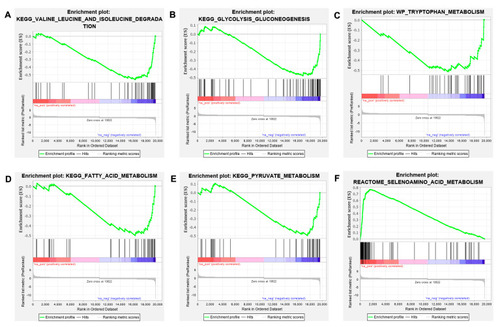
GSEA analysis of the enriched signaling pathways associated with metabolism in tlr2 wild type and mutant zebrafish larvae. (A–E) GSEA analysis results for tlr2 wild type zebrafish larvae group. (F) GSEA analysis results for tlr2 mutant zebrafish larvae group. The gene set C2 (cp.kegg.v.6.2.symbols.gmt) database was used to analyze the whole gene expression dataset of the tlr2 mutant zebrafish and its wild type control group. For more detailed information see Tables S3 and S4. |
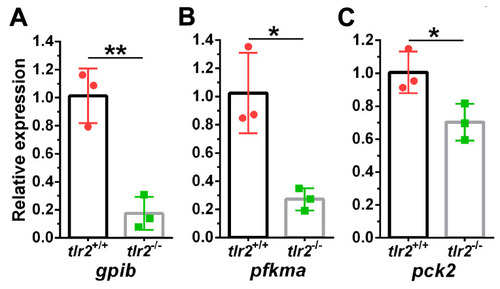
qPCR validation of genes from glycolysis and gluconeogenesis pathway. (A) gpib. (B) pfkma (C) pck2. The information of the genes is shown in Table 1. * represents p < 0.05; ** represents p < 0.01. |
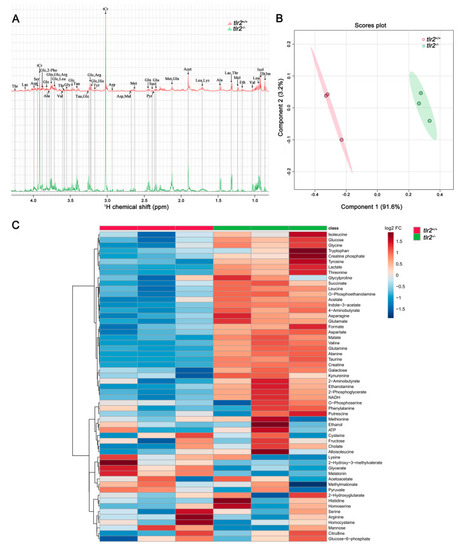
Metabolic profiles of tlr2 mutant zebrafish larvae measured by NMR and analysis by PLS-DA and heatmap clustering. (A) The representative one-dimensional 1H NMR spectra of tlr2 wild type and mutant zebrafish larvae measured by NMR spectrometry. Spectra from chemical shift 0.8 to 4.3 were assigned to specific metabolites. Thr threonine, Lac lactate, Asp aspartate, Ser Serine, tCr total creatine (creatine + phosphocreatine), Glc Glucose, 2-Pho 2-Phosphoglycerate, Ala alanine, Gln glutamine, Arg arginine, Leu leucine, Val valine, Gly glycine, Tau taurine, His Histidine, Tyr tyrosine, Mal Malate, Met Methionine, Suc Succinate, Pyr Pyruvate, Glu glutamate, Acet Acetate, Lys lysine, Mel Melatonin, Eth Ethanol, Isol Isoleucine, 2h3m 2-Hydroxy-3-methylvalerate. (B) PLS-DA analysis of tlr2 wild type and mutant zebrafish larvae groups. N = 3, each replicate represents 120 pooled larvae. (C) Heatmap analysis of 57 metabolites detected in tlr2 wild type and mutant groups. N = 3, each replicate represents 120 pooled larvae. FC represents fold change in tlr2−/− versus tlr2+/+ zebrafish larvae. For more detailed information on significantly differentially expressed metabolites see Table S5. |

Quantitation of metabolites belonging to four significantly enriched metabolism-related pathways in tlr2 mutant zebrafish larvae. (A) The concentration of the metabolites in the valine, leucine, and isoleucine degradation pathway. (B) The concentration of the metabolites in the glycolysis and gluconeogenesis pathway. (C) The concentration of the metabolites in the tryptophan metabolism pathway. (D) The concentration of the metabolites in the fatty acid metabolism pathway. N = 3; * represents p < 0.05; ** represents p < 0.01; *** represents p < 0.001. PHENOTYPE:
|
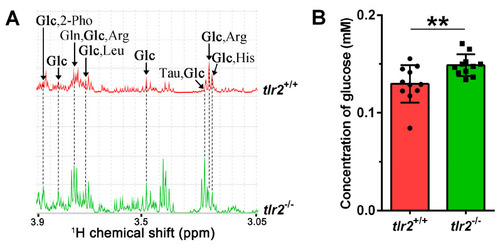
Glucose concentration measurements in zebrafish larvae. (A) One-dimensional 1H NMR spectra of glucose in tlr2 wild type and mutant zebrafish larvae. Glc Glucose, 2-Pho 2-Phosphoglycerate, Gln glutamine, Arg arginine, Leu leucine, Tau taurine, His Histidine. (B) Measurement of the glucose concentration from tlr2 wild type and mutant groups by using glucose kit. Dots and blocks represent individual sample, sample size N = 11, each replicate represents five pooled larvae. ** represents p < 0.01. PHENOTYPE:
|

Schematic diagram of differentially expressed metabolites and genes in the significantly enriched signaling pathways associated with metabolism in tlr2 mutant zebrafish larvae compared to wild type control. (A) Glycolysis and gluconeogenesis pathway. (B) Pyruvate metabolism pathway. (C) Tryptophan metabolism pathway. (D) Valine, leucine, and isoleucine degradation pathway. The notes for each icon in the diagram are at the bottom of the diagram. For RNAseq data, setting the S value ≤ 0.005 as the cutoff to find significantly expressed genes. For NMR data, significance was established at p < 0.05. The genes shown in blue boxes are non-significant downregulated genes in tlr2 mutant larvae (log2 fold change level and S value of pgk1 is -0.59 and 0.022, pgam2: −0.50, 0.061, aldh9a1a.1: −0.56, 0.014, bcat2: −0.45, 0.089, echs1: −0.73, 0.024. Table S2). |