
- Title
-
Loss of pex5 sensitizes zebrafish to fasting due to deregulated mitochondria, mTOR, and autophagy
- Authors
- Bhandari, S., Kim, Y.I., Nam, I.K., Hong, K., Jo, Y., Yoo, K.W., Liao, W., Lim, J.Y., Kim, S.J., Um, J.Y., Kim, P.K., Lee, H.S., Ryu, D., Kim, S.H., Kwak, S., Park, R., Choe, S.K.
- Source
- Full text @ Cell. Mol. Life Sci.
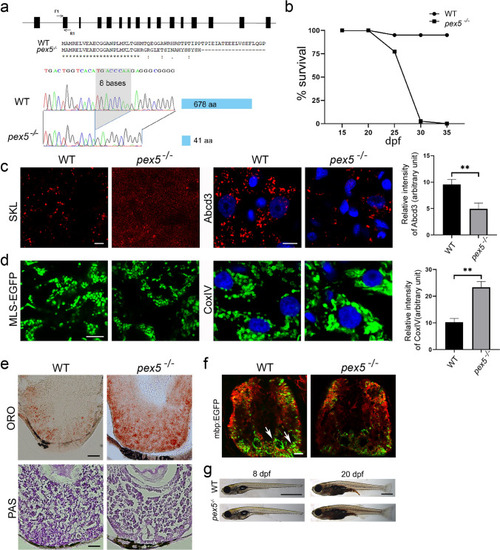
Loss of Pex5 in zebrafish induces liver defects and myelination abnormality due to the decreased peroxisome number. a Schematic view of the genomic structure of pex5 in zebrafish is shown with 16 exons in black rectangles. F1 and R1 indicate the position and direction of the primer sequences that were used for the clustered regularly interspaced palindromic repeat/caspase 9 (CRISPR/Cas9)-mediated gene inactivation. A partial amino-terminal sequence of WT Pex5 is compared to that of Pex5 mutant protein. Note that the 8-base pair deletion shown in the sequencing chromatogram of the pex5 gene is predicted to translate a truncated version of the Pex5 mutant protein comprised only 41 amino acids with a stretch of unrelated carboxy-terminal sequences. b Survival curve for pex5−/− under normal feeding conditions. Heterozygous pex5+/− zebrafish were incrossed, and the percentage of survived larvae per genotype at the indicated developmental times was plotted with assumption of Mendel’s segregation ratios. c Peroxisomes are shown in the liver sections of WT and pex5−/−. The RFP-SKL expression from the Xla.Eef1a1:RFP-SKL transgene was used as a surrogate to detect the subcellular localization of the peroxisomal matrix proteins. The expression levels of endogenous PMP70 proteins detected by immunofluorescence were shown to illustrate an abundance of peroxisome membrane proteins that are independently incorporated in the peroxisome membrane from the matrix-import pathway. Scale bar = 5 μm. Graph shows quantified signal intensity of Abcd3 and presented as the average with error bars indicating standard deviation. Statistical significance was determined using the Student’s t test in Microsoft Excel; * and ** indicate p values < 0.05 and < 0.01, respectively. d Mitochondria are shown in the liver sections of WT and pex5−/−. Expression of mitochondria-targeted enhanced green fluorescent protein (EGFP) (MLS-EGFP) was used to detect the general shape of mitochondria, whereas immunofluorescence of a component of the mitochondrial respiratory chain complex IV (CoxIV) was performed to reveal the differential expression of an endogenous mitochondria-targeted protein. Scale bar = 5 μm. Graph shows quantified signal intensity of CoxIV and presented as the average with error bars indicating standard deviation. Statistical significance was determined using the Student’s t test in Microsoft Excel; * and ** indicate p values < 0.05 and < 0.01, respectively. e Neutral lipids and glycogen are shown by performing Oil Red O and PAS staining, respectively, in the liver sections of WT and pex5−/−. Scale bar = 50 μm. f Neuronal myelination using Tg(mbp:EGFP) transgenic zebrafish was compared between WT and pex5−/−. Red immunofluorescence for acetylated tubulin was used to locate the differentiating neurons in the zebrafish trunk. Arrows indicate myelinated neurons. Scale bar = 50 μm. g Representative pictures of the WT and pex5−/− at 8 and 20 dpf as indicated are shown in lateral views with anterior to the left. Scale bar = 1 mm |
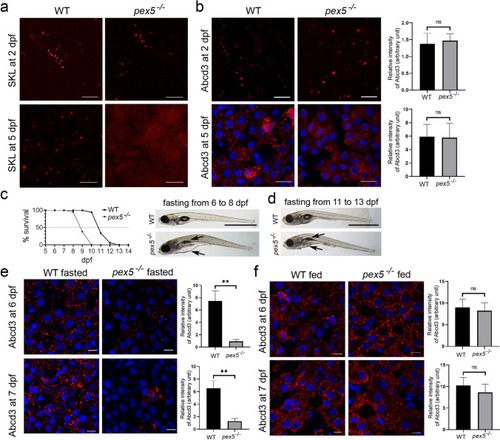
Fasting induces the rapid exacerbation of pex5−/− leading to early mortality. a RFP-SKL was detected using the Xla.Eef1a1:RFP-SKL transgenic zebrafish at 2 dpf in the muscle cells and at 5 dpf in the liver sections of WT and pex5−/−. Note that the SKL signal is diffusely detected in the liver cells of pex5−/− at 5 dpf. Scale bar = 5 μm. b Endogenous Abcd3 proteins were shown by performing immunofluorescence at 2 dpf in the muscle cells and at 5 dpf in the liver sections of WT and pex5−/−. Scale bar = 5 μm. Graphs show quantified signal intensity of Abcd3 at the indicated times and presented as the average with error bars indicating standard deviation. Statistical significance was determined using the Student’s t test in Microsoft Excel. c Survival curve shows a differential survival response between the WT and pex5−/− zebrafish under fasting conditions. Experiments were performed at least three times and the average percentage of surviving animals was used to draw the curve (n = 40/genotype). Representative pictures of the WT and pex5−/− fasted from 5 to 8 dpf are shown in lateral views with anterior to the left. Arrows point to the edematous gut area and deflated swim bladder in fasted pex5−/− at 8 dpf. Scale bar = 1 mm. d Representative pictures of WT and pex5−/− fasted from 11 to 13 dpf are shown as indicated. Scale bar = 1 mm. e, f Peroxisome abundance was compared in the liver cells between the WT and pex5−/− and between the feeding and fasting conditions using immunofluorescence for Abcd3. There was a marked disappearance of peroxisome abundance depending on the pex5 genotype and the nutritional status. Scale bar = 5 μm. Graphs show quantified signal intensity of Abcd3 under fed or fasted conditions at the indicated times and presented as the average with error bars indicating standard deviation. Statistical significance was determined using the Student’s t test in Microsoft Excel; ** indicates p values < 0.01 |
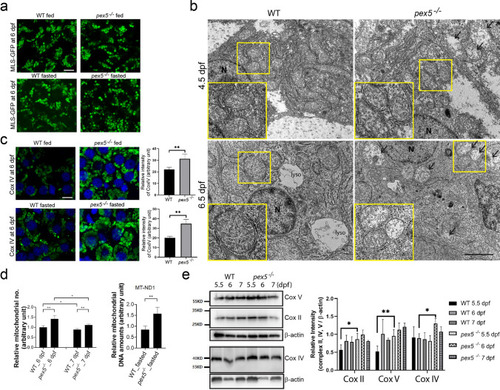
Fasting induces a radical change in the mitochondrial shape and abundance. a Expression of MLS-EGFP from the liver sections of Xla.Eef1a1:MLS-EGFP transgenic zebrafish at 6 dpf is shown to compare between the WT and pex5−/− zebrafish and between the feeding and fasting conditions. Scale bar = 5 μm. b Transmission electron microscope (TEM) images are shown to detect the differential mitochondrial shapes in the liver at 4.5 dpf and 6.5 dpf upon fasting depending on the pex5 genotype. Arrows indicate mitochondria with abnormal cristae structure. Scale bar = 500 nm. c Endogenous expression of a component of CoxIV is shown following immunofluorescence for comparison between the WT and pex5−/− zebrafish liver and between the feeding and fasting conditions. Scale bar = 5 μm. Graphs show quantified signal intensity of CoxIV at the indicated conditions and presented as the average with error bars indicating standard deviation. Statistical significance was determined using the Student’s t test in Microsoft Excel; ** indicates p values < 0.01. d Mitochondrial abundance was analyzed by either counting the number of mitochondria in the liver cells of WT and pex5−/− zebrafish at the indicated stages under fasting conditions (left) or quantifying the mitochondrial DNA amount at 6 dpf in reference to a β-actin genomic region using quantitative polymerase chain reaction (qPCR) (right). Note that the number of mitochondria in the liver cells of fasted WT zebrafish at 6 dpf was set to 1, which was used for reference to quantify those in the rest of the samples. Statistical significance was determined using the Student’s t test in Microsoft Excel; * and ** indicate p values < 0.05 and < 0.01, respectively. e Western blot using whole lysates was performed to compare expression levels of component proteins of the respiratory chain complexes, II V, and IV between WT and pex5−/− at the indicated developmental stages. A representative image is shown, and the expression levels were quantified and presented as the average of three repeats with error bars indicating standard deviation. Statistical significance was determined using the Student’s t test in Microsoft Excel; * and ** indicate p values < 0.05 and < 0.01, respectively |
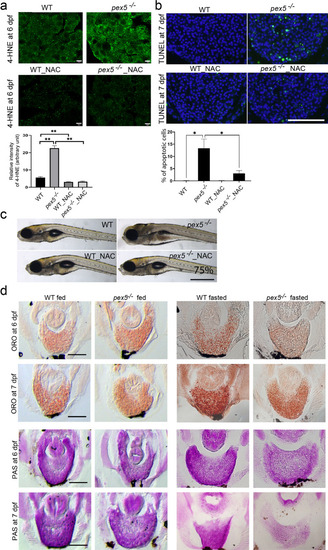
Fasting induces ROS and abnormally increased consumption of hepatic lipids and glycogen in the pex5−/− liver. a 4-hydroxynonenal (4-HNE) was performed in the liver sections of WT and pex5−/− zebrafish at 6 dpf either untreated or treated with 100 μM N-acetyl-cysteine (NAC). Scale bar = 5 μm. Graph shows quantified signal intensity and presented as the average with error bars indicating standard deviation. Statistical significance was determined using the Student’s t test in Microsoft Excel; ** indicates p values < 0.01. b Terminal deoxyribonucleotidyl transferase (TDT)-mediated dUTP nick-end labeling (TUNEL) staining was performed in the liver sections of WT and pex5−/− zebrafish at 7 dpf either untreated or treated with NAC. Positive signals appear in green, and nuclei were stained with 4ʹ, 6-diamidino-2-phenylindole (DAPI) in blue. Scale bar = 100 μm. Graph shows the percentage of apoptotic cells per different conditions with error bars indicating standard deviation. Statistical significance was determined using the Student’s t test in Microsoft Excel; * indicates p values < 0.05. c Representative images of WT and pex5−/− zebrafish at 9 dpf either untreated or treated with NAC. Larvae were shown in lateral views with anterior to the left. Scale bar = 1 mm. d ORO (upper panels) or PAS staining (lower panels) was performed in the liver sections of both fed and fasted WT and pex5−/− zebrafish at 6 and 7 dpf. Representative images are shown. Scale bar = 100 μm |
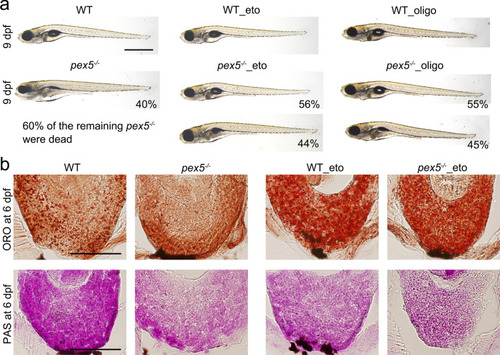
Inhibiting either the mitochondrial β-oxidation or ATP synthase ameliorates the fasting-associated pex5−/− phenotypes. a Either etomoxir (1.5 μM) or oligomycin (5 pM) was treated from 5 to 9 dpf. A representative image from the survived 40% of the fasted, untreated pex5−/− zebrafish is shown, and the remaining 60% larvae were found dead at 9 dpf as indicated. The average percentage representing the degree of rescue from two independent experiments is presented in each panel. Images were shown in lateral views with anterior to the left. Scale bar = 1 mm. b Liver sections from the WT and pex5−/− zebrafish at 6 dpf treated with either etomoxir (eto, 1.5 μM) or oligomycin (oligo, 5 pM) from 5 dpf were shown following either ORO (upper panels) or PAS staining (lower panels). The same staining of liver sections from untreated WT and pex5−/− zebrafish at 6 dpf was shown for comparison. A representative image for each condition is shown. Scale bar = 100 μm |
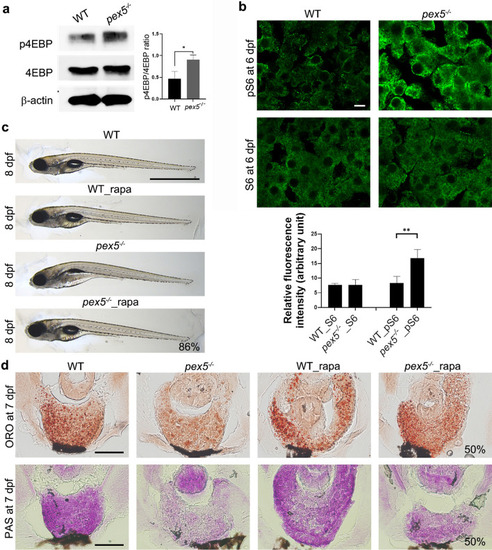
Mechanistic target of rapamycin complex 1 (mTORC1) signaling remains unrepressed in the fasted pex5−/− liver. a Western blotting shows the expression levels of 4EBP and its phosphorylated form from whole lysates of WT and pex5−/− zebrafish at 6 dpf. The expression of β-actin was used as the loading control. Graph shows quantified expression levels of p4EBP relative to β-actin levels and presented as the average of three repeats with error bars indicating standard deviation. Statistical significance was determined using the Student’s t test in Microsoft Excel; * indicates p value < 0.05. b Immunofluorescence was used to detect the differential levels of S6 and its phosphorylated form in the liver cells of WT and pex5−/− at 6 dpf. DAPI detects nuclei in each liver section. Scale bar equals to 5 μm. Graph shows relative fluorescence intensity presented as the average with error bars indicating standard deviation. Statistical significance was determined using the Student’s t test in Microsoft Excel; ** indicates p values < 0.01. c Rapamycin (rapa, 250 nM) was used to treat WT and pex5−/− from 3.5 to 8 dpf and representative images of the resulting larvae were laterally presented with anterior to the left. The average percentage representing a near-complete rescue from two independent experiments is indicated. Scale bar = 1 mm. d Liver sections from the larvae treated with rapamycin from 3.5 to 7 dpf were stained either ORO or PAS. Representative images are shown, and the percentage of rescue in the levels of liver lipids and glycogen are indicated in the panels of the fasted pex5−/− zebrafish treated with rapamycin. Scale bar = 100 μm |
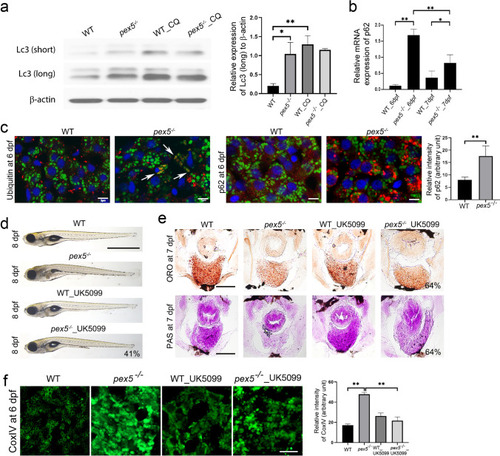
Dysfunctional mitochondria are accumulated in the fasted pex5−/− liver. a Western blotting shows the level of the light chain 3 (Lc3)-II from whole lysates of WT and pex5−/− at 6 dpf with or without chloroquine (CQ, 250 μM). Short and long stand for shorter and longer exposure for film development, respectively. The expression of β-actin was used as the loading control. Graph shows quantified expression levels of Lc3-II (long) relative to β -actin levels and presented as the average of three repeats with error bars indicating standard deviation. Statistical significance was determined using the Student’s t test in Microsoft Excel; * and ** indicate p values < 0.05 and < 0.01, respectively. b Relative expression levels of p62 were determined in reference to those of β-actin by performing quantitative reverse transcription-polymerase chain reaction (qRT-PCR) using total RNA isolated from the liver cells of fasted WT and pex5−/− zebrafish at the indicated stages. Data are presented as the average of three repeats for the relative ratio of p62/b-actin expression. Error bars indicate the standard deviation. Statistical significance was determined using the Student’s t test in Microsoft Excel; * and ** indicate p values < 0.05 and < 0.01, respectively. c Immunofluorescence was performed in liver sections from WT and pex5−/− to detect damaged mitochondria using an anti-Ubiquitin antibody or an autophagy cargo protein using anti-p62 antibody in red as indicated. Mitochondria were visualized through the EGFP signal expressed in the transgenic Tg(Xla.Eef1α1:MLS-EGFP) zebrafish. DAPI stains nuclei in blue in each liver section. Representative images were shown from two independent experiments. Scale bar = 5 μm. Graphs show quantified signal intensity of p62 and presented as the average with error bars indicating standard deviation. Statistical significance was determined using the Student’s t test in Microsoft Excel; ** indicates p value < 0.01. d UK5099 (25 μM) was treated in WT and pex5−/− from 3.5 to 8 dpf, and representative images of the resulting larvae at 8 dpf were laterally presented with anterior to the left. The average percentage representing a near-complete rescue from two independent experiments is indicated. Scale bar equals 1 μm. e Liver sections from the larvae treated with UK5099 from 3.5 to 7 pf were stained either ORO or PAS. Representative images are shown and the percentage of rescue in the levels of liver lipids and glycogen is indicated in the panels of the fasted pex5−/− treated with UK5099. Scale bar = 100 μm. f UK5099 (25 μM) was treated in WT and pex5−/− from 3.5 to 6 dpf, and immunofluorescence was performed in liver sections using anti-CoxIV antibody. Representative images are shown. Scale bar = 5 μm. Graphs show quantified signal intensity of CoxIV at the indicated conditions and presented as the average with error bars indicating standard deviation. Statistical significance was determined using the Student’s t test in Microsoft Excel; ** indicates p value < 0.01 |
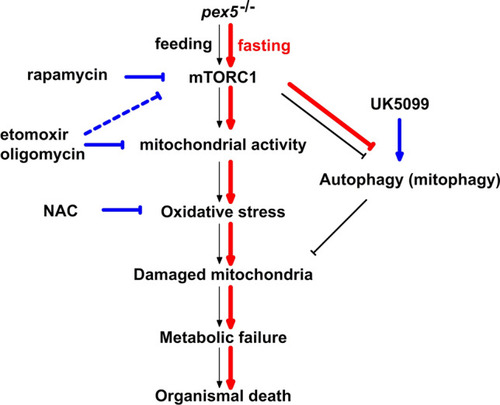
A model to illustrate the fasting-induced early mortality in pex5−/− in this study. Events occurring primarily in the pex5−/− liver under normal fed conditions are shown in black arrows. Briefly, due to dysfunctional peroxisomes, metabolic burden in pex5−/− induces compensatory activation of mitochondria which may then lead to mitochondrial damage and subsequent metabolic failure and organismal death. The entire process may run slow and take almost one month presumably due to the availability of nutrients under fed conditions. However, the process becomes highly facilitated under fasting conditions. mTORC1 becomes repressed in the fasted WT liver but not in the pex5−/− liver. In the fasted pex5−/− liver, mitochondrial activities are upregulated by unrepressed mTORC1 whose activity may also regulated by mitochondrial activity. Further, abnormally high mitochondrial activities may rapidly induce mitochondrial dysfunction and lead to accumulation of damaged mitochondria, which may not be replenished due to the limited autophagic flux. The undesirable condition upon fasting then leads to metabolic failure and results in early mortality of pex5−/−. The events strengthened upon fasting are shown by red arrows. The points of action of drugs that either activate or inhibit the process are shown in blue |