
|
Fig. 3
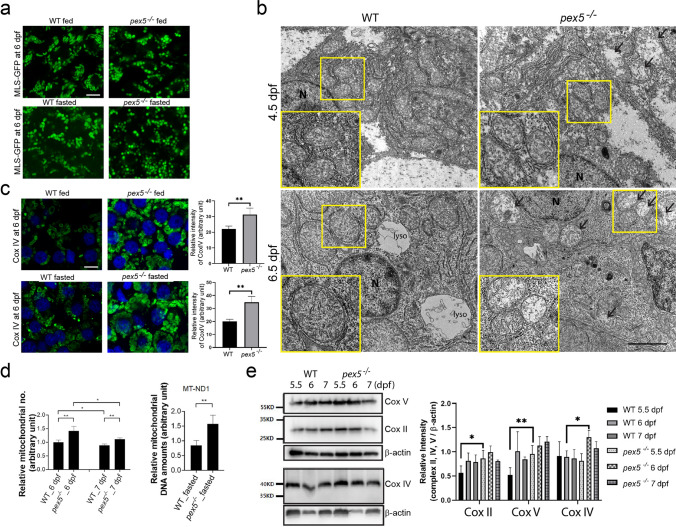
Fasting induces a radical change in the mitochondrial shape and abundance. a Expression of MLS-EGFP from the liver sections of Xla.Eef1a1:MLS-EGFP transgenic zebrafish at 6 dpf is shown to compare between the WT and pex5−/− zebrafish and between the feeding and fasting conditions. Scale bar = 5 μm. b Transmission electron microscope (TEM) images are shown to detect the differential mitochondrial shapes in the liver at 4.5 dpf and 6.5 dpf upon fasting depending on the pex5 genotype. Arrows indicate mitochondria with abnormal cristae structure. Scale bar = 500 nm. c Endogenous expression of a component of CoxIV is shown following immunofluorescence for comparison between the WT and pex5−/− zebrafish liver and between the feeding and fasting conditions. Scale bar = 5 μm. Graphs show quantified signal intensity of CoxIV at the indicated conditions and presented as the average with error bars indicating standard deviation. Statistical significance was determined using the Student’s t test in Microsoft Excel; ** indicates p values < 0.01. d Mitochondrial abundance was analyzed by either counting the number of mitochondria in the liver cells of WT and pex5−/− zebrafish at the indicated stages under fasting conditions (left) or quantifying the mitochondrial DNA amount at 6 dpf in reference to a β-actin genomic region using quantitative polymerase chain reaction (qPCR) (right). Note that the number of mitochondria in the liver cells of fasted WT zebrafish at 6 dpf was set to 1, which was used for reference to quantify those in the rest of the samples. Statistical significance was determined using the Student’s t test in Microsoft Excel; * and ** indicate p values < 0.05 and < 0.01, respectively. e Western blot using whole lysates was performed to compare expression levels of component proteins of the respiratory chain complexes, II V, and IV between WT and pex5−/− at the indicated developmental stages. A representative image is shown, and the expression levels were quantified and presented as the average of three repeats with error bars indicating standard deviation. Statistical significance was determined using the Student’s t test in Microsoft Excel; * and ** indicate p values < 0.05 and < 0.01, respectively