
- Title
-
Post-GWAS screening of candidate genes for refractive error in mutant zebrafish models
- Authors
- Quint, W.H., Tadema, K.C.D., Kokke, N.C.C.J., Meester-Smoor, M.A., Miller, A.C., Willemsen, R., Klaver, C.C.W., Iglesias, A.I.
- Source
- Full text @ Sci. Rep.
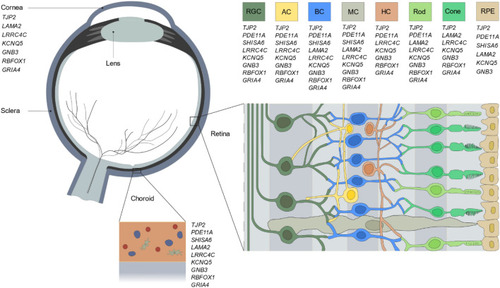
Ocular expression of the prioritized candidate genes. Schematic overview of the expression of the nine candidate genes throughout the human eye. Data on ocular expression was obtained from five independent single-cell RNA sequencing studies |
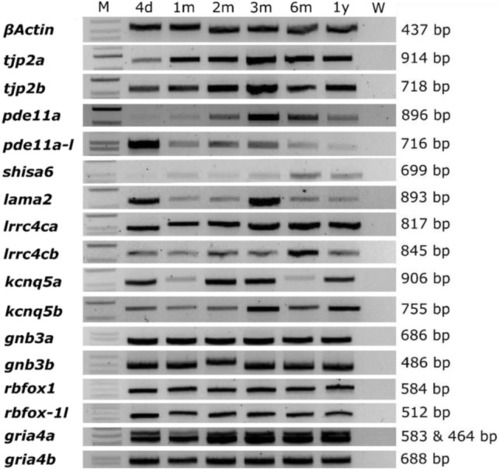
Orthologs of candidate genes are expressed in the zebrafish eye. Agarose gel loaded with RT-PCR product of isolated RNA extracted from zebrafish eyes between 4 days and 1 year post-fertilization. Orthologues genes of human myopia candidate genes showed a continuous expression throughout time. B-actin was used as a positive control. See Supplementary Data |
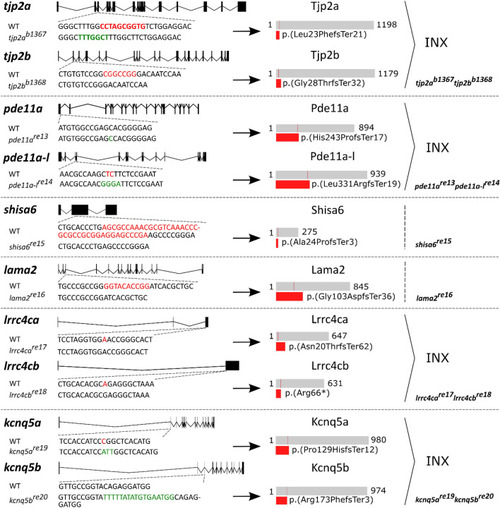
Overview of induced mutations and their predicted effect on protein. Structural representation of the deletions and/or insertions induced by CRISPR-cas9 in the six successfully generated mutant lines. Per gene panel, the dotted lines points to the position of the mutation relative to the gene. Deletions (red) are shown in the WT sequence and insertions (green) in the mutant sequence. A schematic representation of the predicted WT protein (grey) and truncated mutant protein (red) are shown on the right side of the arrow. The region that is predicted to be conserved between the WT and mutant protein is depicted in the WT protein (thin red line). For genes with two orthologues the double mutant generated from crossing the single mutants is depicted on the lower right. WT: wild-type, INX: incross. See Supplementary Data |
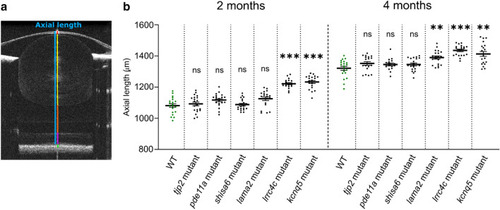
The lama2re16, lrrc4care17lrrc4cbre18, and kcnq5are19kcnq5bre20 mutants showed an increased axial length. (a) Single B-scan image of a typical 4mpf WT zebrafish eye. The axial length (blue) spans from the apical part of the corneal epithelium to the anterior border of the RPE. The gradient refractive index of the spherical zebrafish lens was used as a correction factor to acquire this image (see “Methods”). Individual compartments: cornea and anterior chamber (red), lens (yellow), vitreous chamber (orange), neural retina (magenta) and RPE (green). (b) Axial length of size-matched 2 and 4mpf zebrafish measured by spectral-domain optical coherence tomography. At 2mpf an increase in axial length was found for lrrc4c mutant (Effect size = 140.0 μm, p < 0.0001) and kcnq5 mutant (Effect size = 151.0 μm, p < 0,0001) relative to WT fish. At 4mpf a relative increase was found for lama2 mutant (Effect size = 69.00 μm, p = 0.0083), lrrc4c mutant (Effect size = 114.0 μm, p < 0.0001), and kcnq5 mutant (Effect size = 92.00 μm, p = 0.0044). See Supplementary Data S4 for all data. Error bars: SEM. Significance: ns = not significant, *p < 0.05, **p < 0.01, ***p < 0.001. Mpf: months post-fertilization, RPE: retinal pigmented epithelium, WT: wild-type, tjp2 mutant: tjp2ab1367tjp2bb1368, pde11a mutant: pde11are13pde11a-likere14, shisa6 mutant: shisa6re15, lama2 mutant: lama2re16, lrrc4c mutant: lrrc4care17lrrc4cbre18, kcnq5 mutant: kcnq5are19kcnq5bre20, SEM: Standard error of the mean. PHENOTYPE:
|
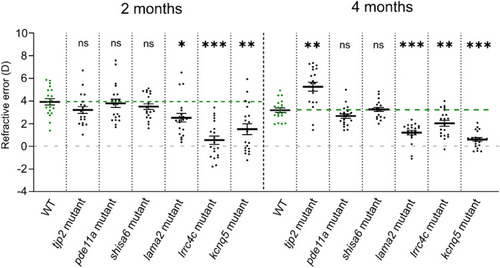
Mutants with increased axial length show a myopic shift in refractive status. Refractive status measured by eccentric photorefraction. The lama2, lrrc4c, kcnq5 mutants showed a myopic shift in refractive status at 2mpf (lama2 mutant: effect size = − 1.4D, p = 0.018; lrrc4c mutant: effect size = − 3.4D, p < 0.0001; kcnq5 mutant: effect size = − 2.4D, p = 0.003) and 4mpf (lama2 mutant: effect size = − 2.0D, p < 0.0001; lrrc4c mutant: effect size = − 1.2D, p = 0.003; kcnq5 mutant : effect size = − 2.6D, p < 0.0001), relative to WT (n = 20 eyes per timepoint). The tjp2 mutant showed a hyperopic shift at 4mpf (effect size = + 2.1D, p = 0.001). See Supplementary Data S5 for all data. Error bars: SEM. Significance: ns = not significant, *p < 0.05, **p < 0.01, ***p < 0.001. Mpf: months post-fertilization, WT: wild-type, tjp2 mutant: tjp2ab1367tjp2bb1368, pde11a mutant: pde11are13pde11a-likere14, shisa6 mutant: shisa6re15, lama2 mutant: lama2re16, lrrc4c mutant: lrrc4care17lrrc4cbre18, kcnq5 mutant: kcnq5are19kcnq5bre20, SEM: Standard error of the mean. PHENOTYPE:
|
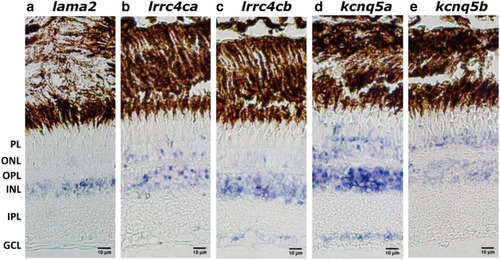
Ocular distribution of lama, lrrc4ca/lrrc4cb and kcnq5a/kcnq5b in zebrafish. In situ hybridization showing the distribution of lama2, lrrc4ca, lrrc4cb, kcnq5a and kcnq5b throughout the 1-year-old WT zebrafish retina. NBT/BCIP, in purple, was used to visualize the probes. Lama2 expression was mainly found in the INL and also modestly in the ONL (a). Lrrc4ca and lrrc4cb expression was found in both ONL and INL (b–c) whilst lrrc4ca expression was also detected in the PL (b) and lrrc4cb expression in the GCL (c). Kcnq5a expression was found in the PL, ONL, INL and GCL (d) whilst kcnq5b expression was found in only the ONL and the INL (e). Scale bars: 10 μm. WT: Wild Type, PL: photoreceptor layer, ONL: outer nuclear layer, OPL: outer plexiform layer, INL: inner nuclear layer, IPL: inner plexiform layer, GCL: ganglion cell layer. EXPRESSION / LABELING:
|