
|
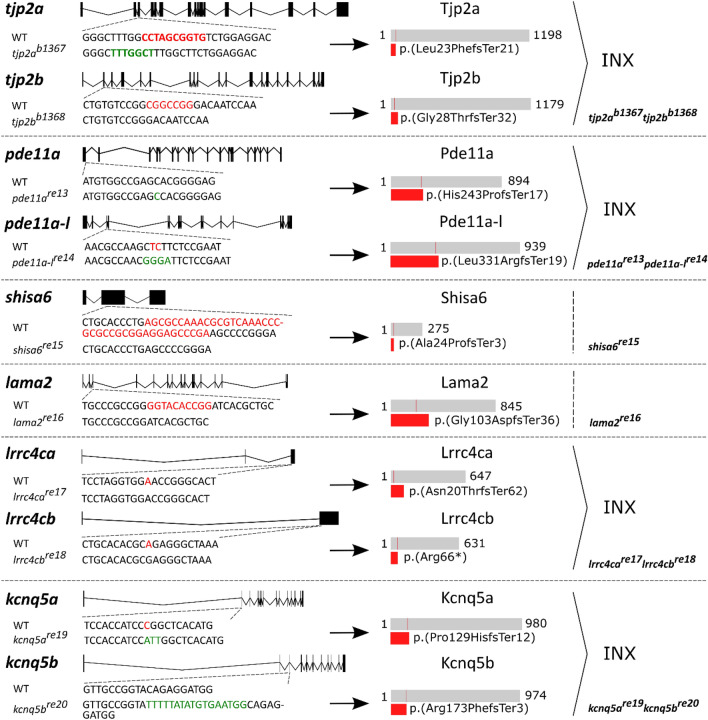
Figure 3
Overview of induced mutations and their predicted effect on protein. Structural representation of the deletions and/or insertions induced by CRISPR-cas9 in the six successfully generated mutant lines. Per gene panel, the dotted lines points to the position of the mutation relative to the gene. Deletions (red) are shown in the WT sequence and insertions (green) in the mutant sequence. A schematic representation of the predicted WT protein (grey) and truncated mutant protein (red) are shown on the right side of the arrow. The region that is predicted to be conserved between the WT and mutant protein is depicted in the WT protein (thin red line). For genes with two orthologues the double mutant generated from crossing the single mutants is depicted on the lower right. WT: wild-type, INX: incross. See Supplementary Data