
- Title
-
Glucocorticoid-sensitive period of corticotroph development-Implications for mechanisms of early life stress
- Authors
- Peles, G., Swaminathan, A., Levkowitz, G.
- Source
- Full text @ J. Neuroendocrinol.
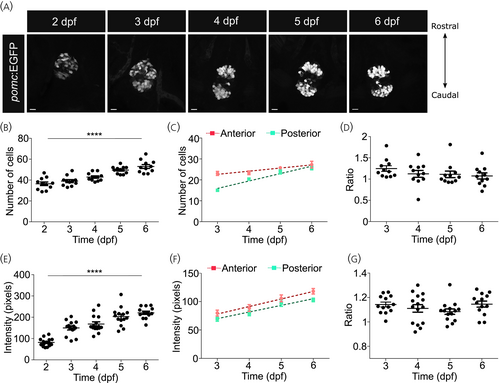
Proopiomelanocortin (POMC) cell number increases gradually during development. (A) Representative images from the pituitary of zebrafish larvae expressing green fluorescent protein (GFP) under a POMC promoter from 2 to 6 days post fertilization (dpf). Larvae were collected and imaged at 24 h intervals from 2 dpf to analyze the development of POMC positive cell clusters in the pituitary. n = 11–15 per group, scale bars: 10 μm. (B, E) From the imaging performed in (A), the total number of GFP-positive cells (B) and the intensity of the GFP-positive clusters (E) were counted. One-way analysis of variance (ANOVA), n = 11 larvae per group. (C, D) The number of cells in the anterior and posterior POMC-expressing clusters in the pituitary was quantified from Day 3, when the clusters were distinct. While the number of cells in individual clusters showed an increase with time (C), and the relative number of cells in the anterior versus the posterior cluster did not change (D). Linear regression for analysis of (C), one-way ANOVA for analysis of (D), n = 11 larvae per group. (F, G) The intensity of GFP-positive POMC cells in the anterior and posterior clusters of the pituitary was quantified from Day 3. GFP intensity in individual clusters showed the same pattern as the cell number. Linear regression for analysis of F, one-way ANOVA for analysis of G, n = 11 larvae per group. Data was analyzed using linear regression. Data presented as mean ± SEM, ****p < .0001. |
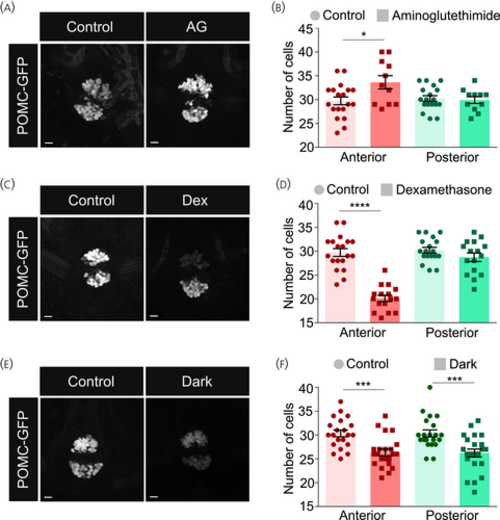
Perturbations of cortisol levels cause alterations in proopiomelanocortin (POMC) cell clusters. (A, B) Larvae were treated with 0.2 mM aminoglutethimide (AG), a cortisol synthesis inhibitor, from 3 to 5 days post fertilization (dpf). Treated and untreated control larvae were collected at 6 dpf and fixed. The pituitary was imaged (A) and the intensity of POMC-positive cells in the anterior and posterior clusters was analyzed. (B) Unpaired t-test comparing anterior and posterior clusters independently, n = 19 control/11 AG– treated. (C, D) Larvae were treated with 35 μM dexamethasone (Dex), a cortisol analogue, from 1 to 5 dpf. Treated and untreated control larvae were collected at 6 dpf and fixed. The pituitary was imaged (C) and the intensity of POMC-positive cells in the anterior and posterior clusters was analyzed. (D) Unpaired t-test comparing anterior and posterior clusters independently, n = 15 per group). (E, F) Larvae were grown in the dark from 1 to 5 dpf. Treated and control larvae (grown in the presence of light–dark cycles) were collected and fixed. The pituitary was imaged (E) and the intensity of POMC-positive cells in the anterior and posterior clusters was analyzed. (F) Unpaired t-test comparing anterior and posterior clusters independently, n = 21 per group. Data presented as mean ± SEM, *p < .05, ***p < .001, ****p < .0001, scale bars: 10 μm. |
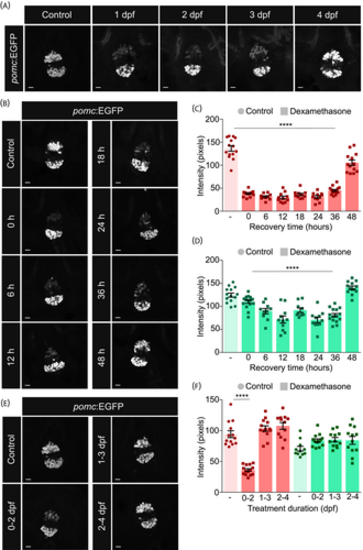
The effect of dexamethasone on proopiomelanocortin (POMC) cells is pronounced at early stages of development but reversible. (A) Larvae were treated with 35 μM dexamethasone beginning at 1, 2, 3 or 4 days post fertilization (dpf). Treated and untreated control larvae were collected at 5 dpf, fixed and the pituitary was imaged. Dexamethasone had a severe effect on the anterior cluster after at least 48 h of treatment. N = 10–15 per group. (B) Larvae were treated with 25 μM dexamethasone from 1 dpf. Dexamethasone was washed off from the larvae from 6 dpf at regular 6 hour intervals. All groups of larvae were collected at 8 dpf, fixed and the pituitary was imaged. Time indicated in hours (h) represents the duration between dexamethasone withdrawal and fixation. N = 11–14 per group. (C, D) The intensity of green fluorescent protein (GFP)-positive POMC cells in the anterior (C) and posterior (D) clusters of the pituitary following different time of withdrawal from dexamethasone was quantified from (B). The reduction in the anterior cluster required 48 h to come back to normal levels. One-way analysis of variance (ANOVA) followed by Dunnett's multiple comparisons test n = 10–16 larvae per group. (E) Larvae were treated with 35 μM dexamethasone for 48 h between 0–2, 1–3, or 2–4 dpf. Dexamethasone was washed off from the larvae at 2, 3 or 4 dpf, respectively, and larvae were let to recover. Larvae were collected at 6 dpf, fixed and the pituitary was imaged. N = 12–14 per group. (F) The intensity of GFP-positive POMC cells in the anterior (red) and posterior (green) clusters of the pituitary following different windows of treatment with dexamethasone was quantified from (E). The reduction in the anterior cluster was irreversible when dexamethasone was applied prior to 24 hpf between 0–2 dpf. One-way ANOVA followed by Dunnett's multiple comparisons test n = 10–16 larvae per group. Data presented as mean ± SEM, *p < .05, ****p < .0001, scale bars: 10 μm. |
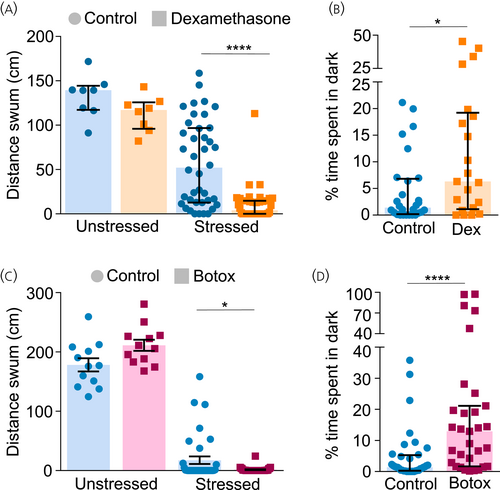
Altered adrenocorticotropic hormone (ACTH) levels result in impaired stress-responsive and anxiety-like behaviour. (A, C) Larvae were treated between 2–6 days post fertilization (dpf) with 35 μM dexamethasone/left untreated (A) or Tg (pomc:Gal4;UAS:BoTxLCB-GFP) were selected (C). At 6 dpf, control and treated/transgenic groups were subjected to osmotic stress by transferring to 50% artificial seawater for 20 min. Larvae were washed, transferred into individual wells of a 96-well plate, and their locomotive behaviour was recorded for 10 min to analyze the effect of osmotic challenge on behaviour. Behaviour of unstressed larvae was used as reference. Two-way analysis of variance (ANOVA) followed by Sidak's post hoc multiple comparisons test; Dexamethasone: n = 8 unstressed/32 stressed (A), Botox: n = 12 unstressed/36 stressed (C). (B, D) Larvae were treated with 35 μM dexamethasone between 4–6 dpf/maintained as control (B) or Tg(pomc:Gal4;UAS:BoTxLCB-GFP) larvae were selected (D). At 6 dpf, control and treated/transgenic larvae were introduced into the dark–light preference chamber and their behaviour was recorded for 10 min. The percentage of total time that the larvae spend in the dark zone was plotted. Mann–Whitney test, n = 28 control/21 dexamethasone (B); n = 36 control/32 Botox (D). Data presented as median ± range, *p < .05, **p < .01, ****p < .0001. |