
|
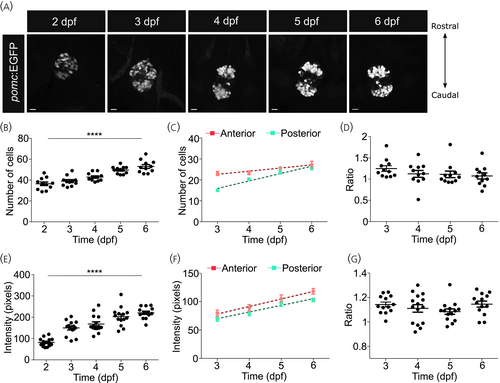
Fig. 1 Proopiomelanocortin (POMC) cell number increases gradually during development. (A) Representative images from the pituitary of zebrafish larvae expressing green fluorescent protein (GFP) under a POMC promoter from 2 to 6 days post fertilization (dpf). Larvae were collected and imaged at 24 h intervals from 2 dpf to analyze the development of POMC positive cell clusters in the pituitary. n = 11–15 per group, scale bars: 10 μm. (B, E) From the imaging performed in (A), the total number of GFP-positive cells (B) and the intensity of the GFP-positive clusters (E) were counted. One-way analysis of variance (ANOVA), n = 11 larvae per group. (C, D) The number of cells in the anterior and posterior POMC-expressing clusters in the pituitary was quantified from Day 3, when the clusters were distinct. While the number of cells in individual clusters showed an increase with time (C), and the relative number of cells in the anterior versus the posterior cluster did not change (D). Linear regression for analysis of (C), one-way ANOVA for analysis of (D), n = 11 larvae per group. (F, G) The intensity of GFP-positive POMC cells in the anterior and posterior clusters of the pituitary was quantified from Day 3. GFP intensity in individual clusters showed the same pattern as the cell number. Linear regression for analysis of F, one-way ANOVA for analysis of G, n = 11 larvae per group. Data was analyzed using linear regression. Data presented as mean ± SEM, ****p < .0001.