
- Title
-
CRISPR/Cas9-Induced Inactivation of the Autism-Risk Gene setd5 Leads to Social Impairments in Zebrafish
- Authors
- Gabellini, C., Pucci, C., De Cesari, C., Martini, D., Di Lauro, C., Digregorio, M., Norton, W., Zippo, A., Sessa, A., Broccoli, V., Andreazzoli, M.
- Source
- Full text @ Int. J. Mol. Sci.

ZFIN is incorporating published figure images and captions as part of an ongoing project. Figures from some publications have not yet been curated, or are not available for display because of copyright restrictions. |
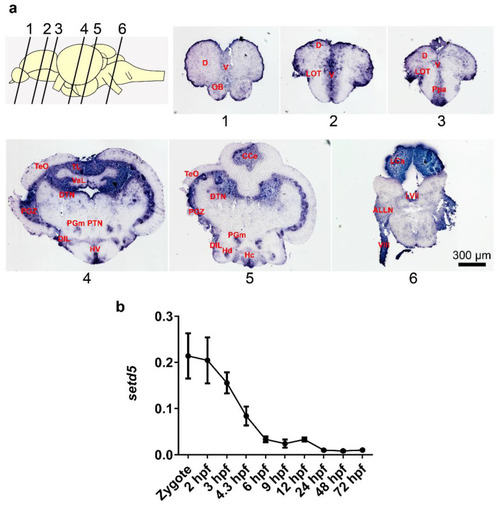
setd5 is expressed in the zebrafish adult brain and at early stages of zebrafish embryo development. (a) setd5-203 isoform localization on zebrafish WT brain sections at 10/12 months of age performing in situ hybridization technique. Representative images of a section corresponding to telencephalon (1–3), diencephalon-mesencephalon (4,5) and rhombencephalon (6), n = 3 brains analyzed. Scale bar 300 µm. (b) Expression of setd5 isoforms in zebrafish embryos and larvae at different developmental stages, obtained by RT-qPCR analysis. Data are expressed as 2−(ΔCt) mean ± Standard Error of the Mean (SEM), using b-actin1 as housekeeping gene. n = 3 independent experiments. Abbreviations: D, Dorsal telencephalic area; V, Ventral telencephalic area; OB, Olfactory bulb; LOT, Lateral olfactory tract; Ppa, Parvocellular preoptic nucleus; TL, Longitudinal Torus; Val, Lateral division of valvular cerebelli; TeO, Tectum opticum; PGZ, Periventricular gray zone of optic tectum; DTN, Dorsal tegmental nucleus; HV, Ventral zone of periventricular hypothalamus; PTN, Posterior tuberal nucleus; PGm, Medial progromerular nucleus; DIL, Diffuse nucleus of the inferior lobe; Hc, Caudal zone of periventricular hypothalamus; Hd, Dorsal zone of the periventricular hypothalamus; CCe, Cerebellar corpus; LCa, Caudal lobe of cerebellum; LVII, Facial lobe; ALLN, Anterior lateral line nerves; VIII, Octaval nerve; hpf, hours post fertilization EXPRESSION / LABELING:
|
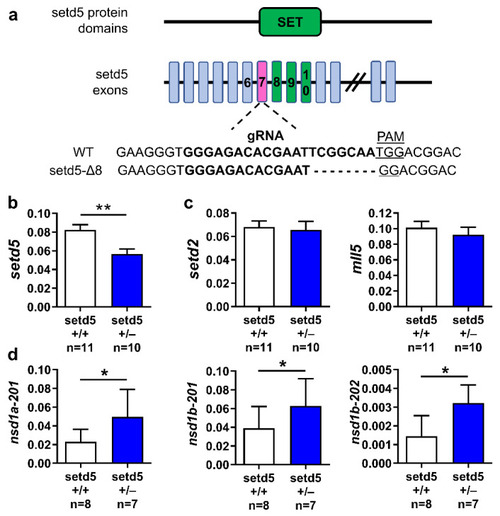
Location of the eight-nucleotide deletion in setd5 gene (setd5-Δ8) and its effects on the expression of selected genes. (a) Schematic representation of the main zebrafish Setd5 protein domains and the corresponding exons, highlighting the SET domain (in green). The 20-nucleotide sequence corresponding to gRNA in exon 7 (in magenta) encoding sequence is indicated, as well as the PAM sequence, aligned to the deleted setd5 mutant sequence obtained by CRISPR/Cas9 gene editing technique. (b–d) Expression of setd5 (b), setd5 paralogues setd2 and mll5 (c), nsd1a and nsd1b isoforms (d) in setd5+/+ and setd5+/− adult zebrafish brains, obtained by RT-qPCR analysis. The values are expressed as 2−(ΔCt), using bactin1 as the housekeeping gene. (b–d) n = number of adult brains analyzed. Data are expressed as mean ± SEM. Statistical analysis was performed by Student’s t-test. * p < 0.05; ** p < 0.01. |
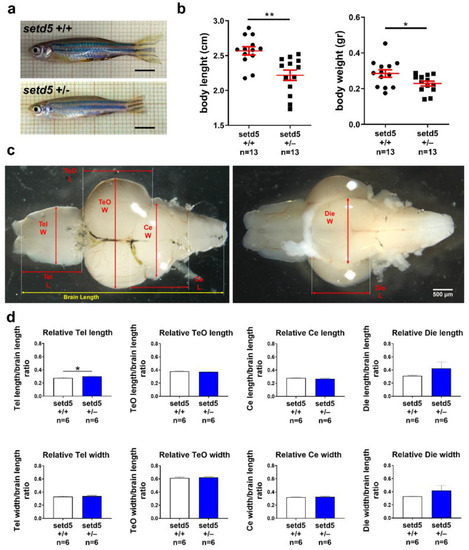
setd5 haploinsufficiency causes a growth delay in adult mutant zebrafish. (a) Representative images of 10-month-old setd5+/+ and setd5+/− zebrafish adults. Scale bar 500 μm. (b) Body length and body weight analysis in setd5+/+ and setd5+/− 10 months-old zebrafish adults. n = number of adults analyzed. (c) Representative images of adult brains from 10-month-old setd5+/+ zebrafish adults, evidencing the different measurements conduced for the morphometrical analysis included in (d). W, width; L, length. (d) Relative Telencephalon (Tel) length and width, Optic tectum (TeO) length and width, Cerebellum (Ce) length and width, Diencephalon (Die) length and width in adult brain, normalized to the entire brain length, from 10-month-old setd5+/+ zebrafish adults. Absolute values are included in Figure S5. (d) n = number of adult brains analyzed. Data are expressed as mean ± SEM. Statistical analysis was performed by Student’s t-test. * p < 0.05; ** p < 0.01. PHENOTYPE:
|

setd5 haploinsufficiency impairs the growth in mutant zebrafish embryos. (a) Body length, (b) eye area and (c) eye diameter/body length ratio analysis in setd5+/+ and setd5+/− embryos at 2 days post fertilization (dpf). (d) Distance moved and (e) speed of setd5+/+ and setd5+/− larvae at 6 dpf evaluated during a 5-min-long open field test. (a–e) Statistical analysis was performed using the Student’s t-test. Data are expressed as mean ± SEM; n = number larvae analyzed. * p < 0.05; *** p < 0.001; **** p < 0.0001. PHENOTYPE:
|
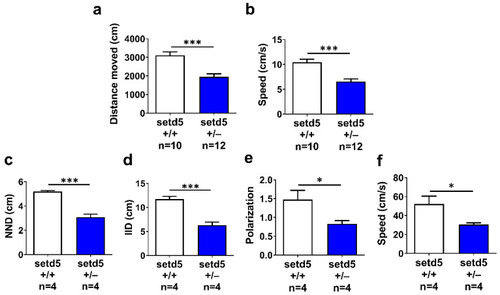
setd5 haploinsufficiency alters locomotor activity and induces an anxiety-like shoaling behavior in adult mutant zebrafish. (a) Distance moved and (b) speed (cm/s) of setd5+/+ and setd5+/− adult fish evaluated during a 5-min-long open field test.; n = number of fishes analyzed. (c) Nearest Neighbor Distance (NND), (d) Inter-Individual Distance (IID), (e) polarization and (f) mean speed of fish groups constituted by 4 setd5+/+ or setd5+/− adults, evaluated by a shoaling test. (a–f) n = number of group of fish analyzed. Data are expressed as mean ± SEM. Statistical analysis was performed by Student’s t-test. * p < 0.05; *** p < 0.001. |
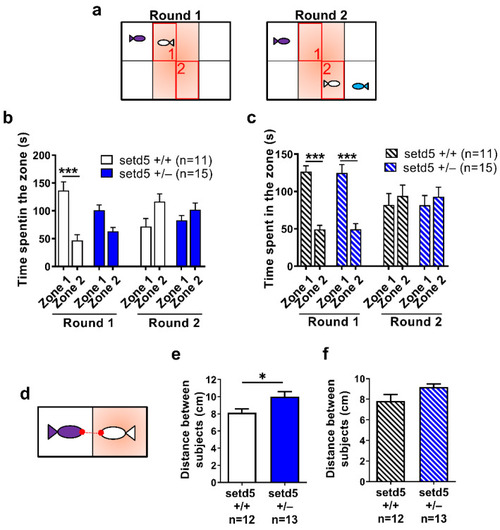
The antipsychotic drug Risperidone ameliorates the social behavior impairment of setd5 adult mutant zebrafish. (a) Set-up of zebrafish adult fish during the two rounds of social preference test on the fish (white) included in the central arena. Zone 1 and zone 2, highlighted in red, indicates the areas of the arena near to the first stimulus (purple) and social novelty stimulus (blue) added at round 2. (b,c) Time spent by setd5+/+ and setd5+/− adult fish in zone 1 and zone 2, in both rounds of social preference test, for untreated (b) and Risperidone-treated fishes (c). (d) Set-up of the social behavior test, evidencing the distance between the nose points (in red) between the tested fish (white) and the social stimulus (purple). (e,f) Social behavior of setd5+/+ and setd5+/− adult fish, evaluated in terms of distance between the nose points of the subjects, untreated (e) and Risperidone-treated fish (f). (b,c,e,f) Data are expressed as mean ± SEM; n = number of fish analyzed. (b,c,e,f) Statistical analysis was performed using (b,c) 1-way ANOVA followed by post-hoc test or (e,f) Student’s t-test. * p < 0.05; *** p < 0.001. PHENOTYPE:
|
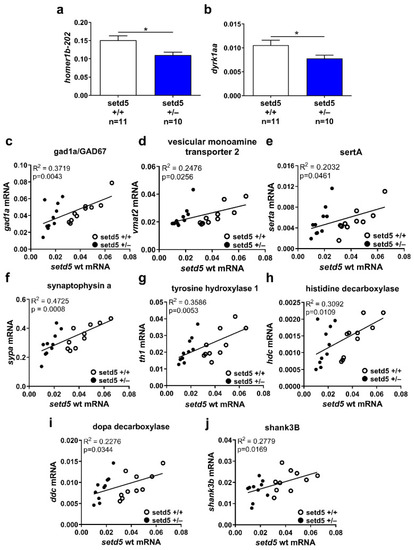
setd5 haploinsufficiency affects mRNA expression levels of synaptic regulators. (a,b) Expression of homer1b-202 (a) and dyrk1aa (b) in setd5+/+ and setd5+/− adult zebrafish brains, obtained by RT-qPCR analysis. The values are expressed as 2−(ΔCt), using bactin1 as the housekeeping gene. n = number of adult brains analyzed. Data are expressed as mean ± SEM. Statistical analysis was performed using a Student’s t-test. * p < 0.05. (c–j) Linear regression analysis between setd5 wild type mRNA level and gad1a/GAD67 (c), vesicular monoamine transporter 2 (d), sertA (e), synaptophysin a (f), tyrosine hydroxylase 1 (g), histidine decarboxylase (h), dopa decarboxylase (i), and shank3B (j) in setd5+/+ (empty dots) and setd5+/− (full dots) adult zebrafish brains, obtained by RT-qPCR analysis. R2 = coefficient of determination. A linear regression-fitting curve is shown. |