
- Title
-
Ontogenesis of the asymmetric parapineal organ in the zebrafish epithalamus
- Authors
- Palma, K., Signore, I.A., Meynard, M.M., Ibarra, J., Armijo-Weingart, L., Cayuleo, M., Härtel, S., Concha, M.L.
- Source
- Full text @ Front Cell Dev Biol
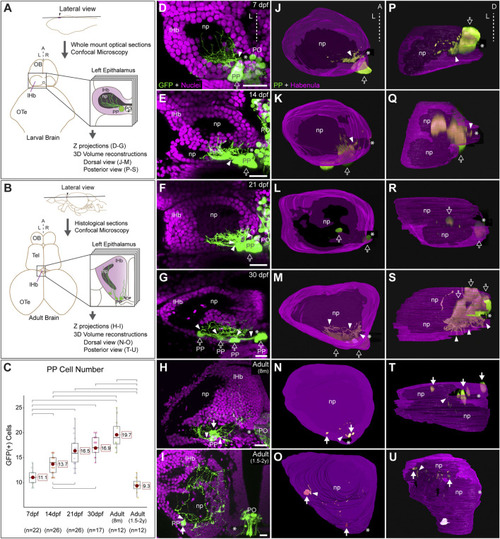
Post-hatching ontogeny of parapineal morphology and connectivity in zebrafish. (A,B) Schemes of larval (A) and adult (B) zebrafish brains showing the overall anatomy of the epithalamus in dorsal views and the position of optical and histological sections analysed in the rest of the panels. The left side of the epithalamus is highlighted and enlarged in a square containing the left habenula (magenta) and the parapineal (green). The position of the habenular commissure is indicated with an asterisk. (C) Box plot showing the quantification of GFP(+) parapineal cells in larvae (7, 14 and 21 dpf), juveniles (30 dpf) and adults (8 mpf and 1.5–2 years old). N for each group are shown below the x-axis. Significance was set to p < 0.001 (upper square brackets) or p < 0.01 (lower square brackets). The red circle on each bar is the mean for the group and its value is indicated with red square labels. The horizontal line in the box is the median of the group. (D–I) Ontogeny of parapineal morphology and connectivity revealed by immunofluorescence against GFP (green) and DAPI/Hoechst staining (magenta) in Tg(foxd3::GFP) zebrafish. Images correspond to dorsal views of representative confocal z-stacks maximum projections of the left epithalamus at 7 dpf (D), 14 dpf (E), 21 dpf (F), 30 dpf (G), 8 months (H) and 1.5–2 years old (I), with anterior to the top, left to the left and the midline (dotted line) towards the right side of the panel. Arrowheads indicates the site where parapineal projections emerge, often forming a thick bundle at earlier stages. Empty arrows indicate the parapineal cell body as long it is recognizable as a single large cluster. White arrows indicate parapineal cell groups scattered along the posterior border of the left habenula. (J–O) Dorsal views of 3D reconstructions of the left habenula (magenta = cell bodies; black = neuropil) and parapineal (green) at 7 dpf (J), 14 dpf (K), 21 dpf (L), 30 dpf (M), 8 months (N) and 1.5–2 years old (O), with anterior to the top, left to the left and the midline (dotted line) towards the right side of the panel. (P–U) Posterior views of 3D reconstructions of the left habenula (magenta = cell bodies; black = neuropil) and parapineal (green) at 7 dpf (P), 14 dpf (Q), 21 dpf (R), 30 dpf (S), 8 months (T) and 1.5–2 years old (U), with dorsal to the top, left to the left and the midline (dotted line) towards the right side of the panel. Abbreviations: A (anterior), D (Dorsal), L (left), lHb (left habenula), np (habenular neuropil), OB (Olfatory Bulb), OTe (Optic Tectum), PO (pineal organ at the level of the stalk), PP (parapineal), R (right), Tel (Telencephalon). Scale bars, 10 µm. |
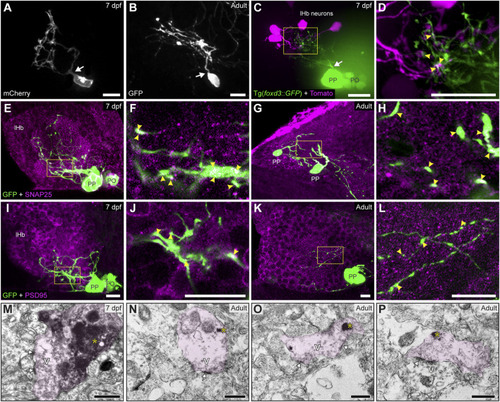
Contacts and synapses between parapineal cells and the left habenular neuropil in the larva and adult zebrafish. (A,B) Dorsal views of confocal z-stack maximum projections showing single parapineal cells expressing mCherry in a living larva at 7 dpf (A) and GFP in a section of the 1.5–2 years old adult brain (B) after immunostaining against this fluorescent protein. At both stages, parapineal cells show a characteristic pear-shape cell body with a single projection emerging from it (white arrows) and then branching profusely. (C,D) Dorsal views of confocal z-stack maximum projections showing 4 habenular neurons expressing the fluorescent protein Tomato (magenta) in a living 7 dpf Tg(foxd3::GFP) larva expressing GFP in the pineal complex (green). Projections emerge from the parapineal body as a bundle (white arrow), then branch in the left habenula to intermingle with the dendritic arbour of the labelled habenular neurons. The image in (D) corresponds to a z-plane of the yellow rectangle depicted in (C), showing the punctuated zones where the fluorescent signals corresponding to parapineal projections (green) closely associate with the fluorescence signals corresponding to habenular dendrites (magenta). (E–L) Dorsal views of immunofluorescence against presynaptic (SNAP25) and postsynaptic (PSD95) markers in the epithalamus of larval (7 dpf) and adult (1.5–2 years old) zebrafish. Images correspond either confocal z-stack maximum projections (E,G,I,K) or to single z-planes (F,H,J,L; corresponding to the yellow rectangles depicted in E,G,I,K, respectively) of larval (E,F,I,J) and adult (G,H,K,L) animals. Yellow arrowheads point to zones where the fluorescent signal from to parapineal projections (green) closely associate with the immunofluorescence signal of the synaptic protein (magenta). (M–P) TEM images showing the synaptic relation between parapinal cells and the habenular neuropil at larval (7 dpf) (M) and adult (1.5–2 years old) (N–P) stages. GFP-immunopositive terminals of parapineal projections showing black DAB precipitates (yellow asterisks) are shaded in pink. These terminals show synaptic vesicles (v) and synaptic densities (white arrows) both in larvae and adults. Abbreviations: lHb (left habenula), PO (pineal organ at the level of the stalk), PP (parapineal). Scales bars, 10 µm (A–L), 500 nm (M–P). |
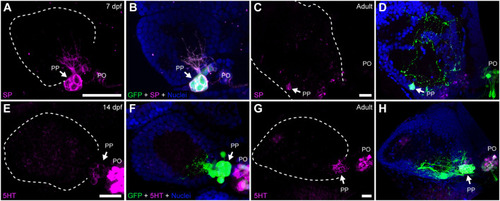
Parapineal cells show immunoreactivity against substance P and serotonin during ontogeny. Indirect immunofluorescence against substance P (SP) (A–D) and serotonin (5HT) (E–H) in larval (7 and 14 dpf) and adult (1.5–2 year old) Tg(foxd3::GFP) zebrafish. Images correspond to dorsal views of confocal z-stack maximum projections, with anterior to the top and left to the left, showing the fluorescence signal corresponding to SP (magenta in (A,C)) and 5HT (magenta in (E,G)), or the merge fluorescence signals that also include the GFP of the pineal complex (green) and the DAPI/Hoechst nuclear staining providing the left habenula tissue context (blue) (B,D,F,H). Arrows indicate parapineal neurons immunoreactive to SP and 5HT. Abbreviations: PO (pineal organ at the level of the stalk), PP (parapineal). Samples: 7 dpf SP (n = 5), adult SP (n = 5), 14dpf 5HT (n = 5), adult 5HT (n = 5). Scale bars, 10 µm. |
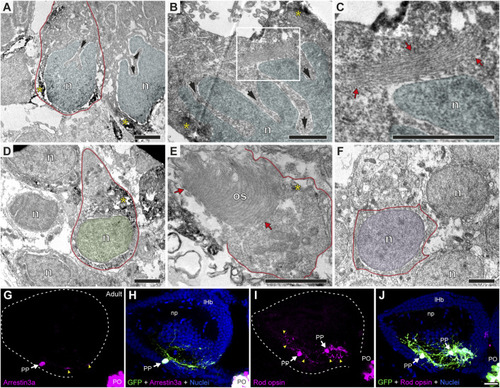
Parapineal cells show ultrastructural and immunohistochemical features distinctive from other epithalamic cells and suggestive of a photosensitive function in the adult zebrafish. (A–F) TEM images showing the cell types found in the adult (1.5–2 years old) zebrafish epithalamus: parapinealocytes ((A–C); nucleus labelled in light blue), pinealocytes ((D,E); nucleus labelled in green) and habenular cells ((F); nucleus labelled in pink). GFP-immunopositive parapinealocytes and pinealocytres display black DAB precipitates (yellow asterisks). The cell membrane is depicted as a red line. Parapinealocytes show a pear-shape cell body (red outline in (A)), a nucleus with indentations or clefts (black arrows in (A,B)), and a lamellar structure near the nucleus (red arrows in (C), which correspond to a high magnification view of the white rectangle depicted in (B)). Pinealocytes also show a pear-shape cell body (red outline in (D)) but the nucleus lacks indentations and shows an external segment characteristic of photoreceptors (red arrows in (E)). The cell body of habenular neurons is mostly occupied by its round and regular nucleus (E). (G–J) Immunofluorescence against Arrestin3a (G,H) and Rod opsin (I,J) in adult (1.5–2 years old) Tg(foxd3::GFP) zebrafish. Images correspond to dorsal views of confocal z-stack maximum projections, with anterior to the top, showing in the left epithalamus the fluorescence signal corresponding to Arrestin3a (magenta in (G)) and Rod opsin (magenta in (I)), or the merge fluorescence signals that also include the GFP of the pineal complex (green) and the DAPI/Hoechst nuclear staining that provides the left habenula tissue context (blue) (H,J). White arrows and yellow arrowheads indicate immunoreactive parapineal cell bodies and projections, respectively. Abbreviations: n (nucleus), os (outer segment). PO (pineal organ at the level of the stalk), PP (parapineal). Adult samples: Arrestin3a (n = 4), Rod opsin (n = 6). Scale bars, 1 µm (B, C), 2 µm (A,D–F) and 10 µm (G–J). |