FIGURE SUMMARY
Title

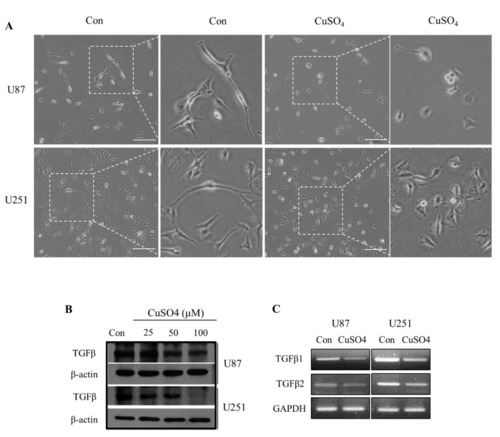
Effect of Copper Chelators via the TGF-β Signaling Pathway on Glioblastoma Cell Invasion

Authors
Kim, H., Jo, S., Kim, I.G., Kim, R.K., Kahm, Y.J., Jung, S.H., Lee, J.H.
Source
Full text @ Molecules

(A) The effect of control and 100 μM CuSO4 on morphology of U87 and U251 cells seeded in dishes and treated for 24 h. Scale bars: 100 µm. (B) The change in expression levels of TGF-β in GBM cells treated with CuSO4 (25, 50, and 100 µM). (C) The mRNA expression levels of TGF-β1 and 2 in cells treated with 100 µM CuSO4.

(A) The cytotoxicity at concentrations of 25, 50, and 100 μM CuSO4 with 100 μM chelators (TETA or DPA) using a CCK-8 assay in GBM cells. (B) Cellular viability using CCK-8 assay in GBM cells treated with various concentrations of chelators in 50 μM of CuSO4. (C) Colony formation in GBM cells treated with 50 μM of CuSO4 and 100 μM chelators. (D) Morphology of U87 and U251 cells treated with 50 μM of CuSO4 and 100 μM chelators. Scale bars: 100 µm. Data represent mean ± SD of three independent experiments using two-tailed t-test. * p < 0.05, ** p < 0.01, *** p < 0.001.

(A) Wound healing capacity of U87 and U251 cells treated with 50 μM of CuSO4 and 100 μM chelators. Scale bars: 200 µm. (B) The migration/invasion assay indicating that treatment of CuSO4 and DPA was highly effective in GBM cell migration and invasion in both cell lines. Scale bars: 200 µm. (C) The expression of EMT regulators and transcription factors in GBM cells using RT-PCR. (D) Immunofluorescent analysis of N-cadherin, after treatment with CuSO4 with chelators in GBM cells. Scale bars: 100 µm. Data represent mean ± SD of three independent experiments using two-tailed t-test. * p < 0.05, ** p < 0.01, *** p < 0.001.

(A) The transcriptional levels of TGF-β1 and TGF-β2 compared with cells treated with CuSO4 and chelators using RT-PCR. (B) The effect of copper with chelators on TGF-β/Smad signaling in GBM cells evaluated by Western blotting assay. (C) Wound healing assays of absence or presence of 40 ng/mL TGF-β1 in 50 μM CuSO4 and images obtained at 48 h. Scale bars: 200 µm. (D) The expression of EMT regulators in GBM cells evaluated using Western blot assay. (E) Measurement of a copper concentration treated with 50 μM CuSO4 with various concentrations of chelators using a copper assay kit. Data represent mean ± SD of three independent experiments using two-tailed t-test. *** p < 0.001.

(A) Representative images at higher magnification show the invasive U87 cells (red) in the tail region of the embryos via vessels (green). Scale bars: 200 µm. (B) At 5 days post injection, the survival and metastatic rate of Tg (kdrl:EGFP) zebrafish embryos microinjected with CM-DiI U87 cells (n = 50/each group). * p < 0.05, ** p < 0.01, *** p < 0.001.

Acknowledgments
This image is the copyrighted work of the attributed author or publisher, and ZFIN has permission only to display this image to its users. Additional permissions should be obtained from the applicable author or publisher of the image. Full text @ Molecules