
- Title
-
Phytochemicals, Antioxidant Activities, and Toxicological Screening of Native Australian Fruits Using Zebrafish Embryonic Model
- Authors
- Ali, A., Kiloni, S.M., Cáceres-Vélez, P.R., Jusuf, P.R., Cottrell, J.J., Dunshea, F.R.
- Source
- Full text @ Foods
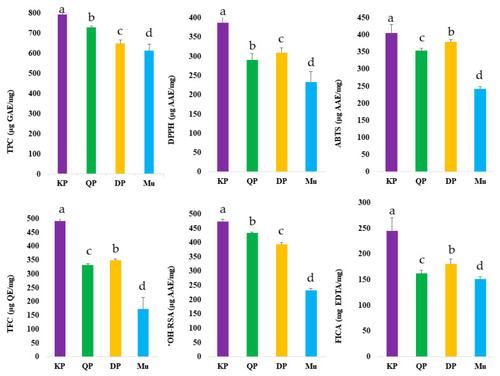
Quantification of phenolic contents and antioxidant activities of native Australian Muntries (Mu), Kakadu plum (KP), Davidson plum (DP), and Quandong peach (QP). Values with the letters (a–d) are significantly different from each other (p < 0.05). |
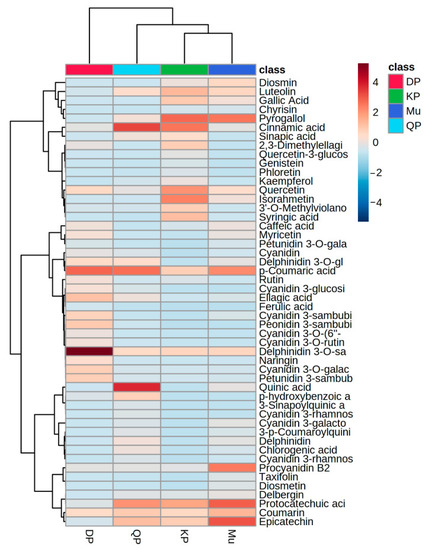
Heatmap hierarchical clustering of quantified phenolic compounds in Davidson plum (DP), Quandong peach (QP), Kakadu plum (KP), and Muntries (Mu). |
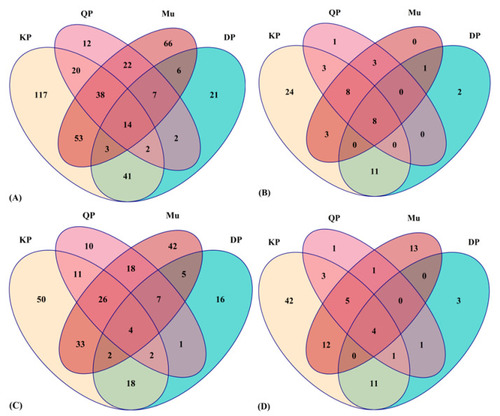
Venn diagram distribution of the total number of phytochemicals (A), the total number of phenolic acids (B), the total number of flavonoids (C), and the total number of other polyphenols (D) in Muntries (Mu), Kakadu plum (KP), Davidson plum (DP) and Quandong peach (QP). |
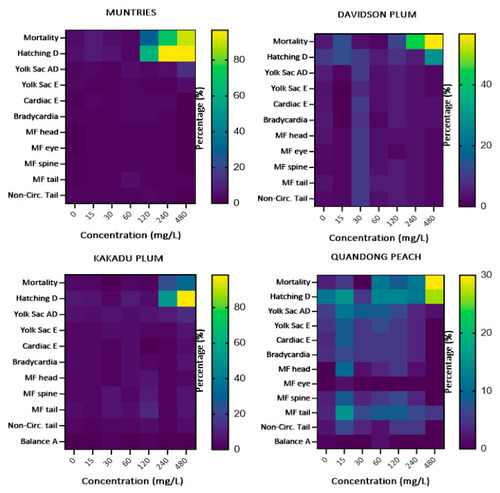
Heatmaps of the changes in zebrafish embryos during the exposure of Australian muntries, Davidson plum, Kakadu plum, and Davidson plum extracts at 96 h. |
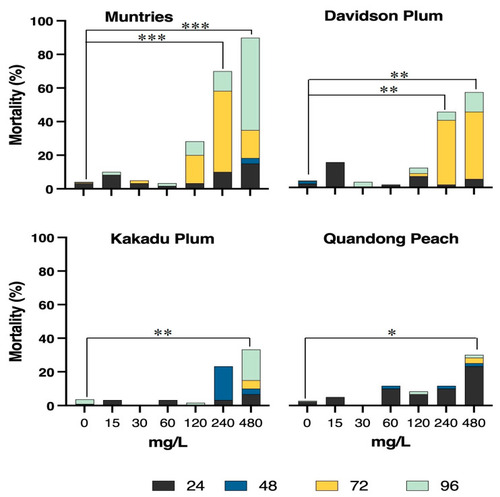
Percentage of mortality observed in zebrafish embryos exposed during 96 h to different concentrations of native Australian fruits. The colors represent the time at which mortality was observed. Significant differences are observed for muntries at 240 and 480 mg/L compared to controls (0), both values represented by *** p < 0.001. Davidson plum: ** p < 0.01 for 240 and 480 mg/L compared to controls (0). Kakadu plum: ** p < 0.01 for 480 mg/L compared to controls (0). Quandong peach: * p ≤ 0.05 at 480 mg/L compared to controls (0). |
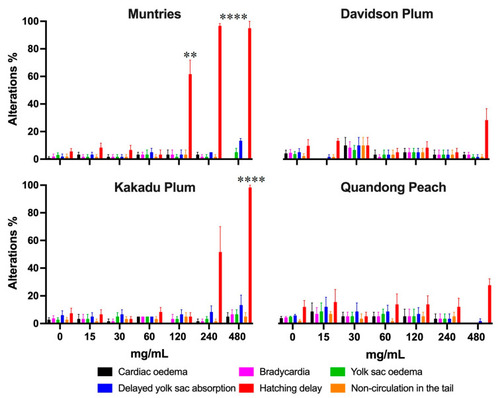
The graph shows the developmental alterations and morbidity in zebrafish embryos exposed for 96 h to different concentrations of native Australian fruits. Bars represent the mean ± SEM compared to the control group (p < 0.0001). Statistical significance represented by ** p ≤ 0.01, and **** p ≤ 0.0001. |
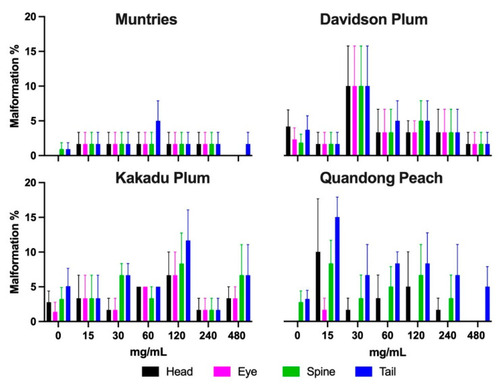
Malformations were observed in zebrafish exposed during 96 h post-fertilization to different concentrations of Kakadu plum, Davidson plum, quandong peach, and muntries. No statistically significant difference was observed, and the data represent the mean ± SEM. |