
Image
|
Figure Caption
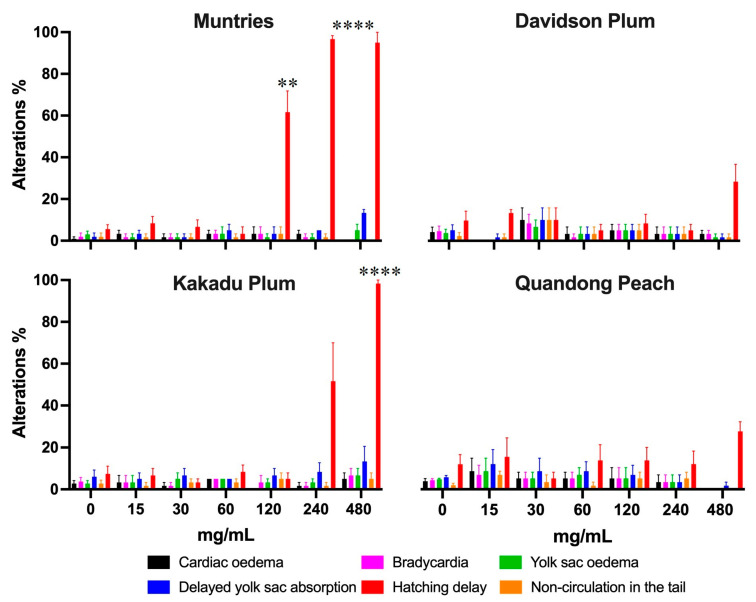
Figure 6 The graph shows the developmental alterations and morbidity in zebrafish embryos exposed for 96 h to different concentrations of native Australian fruits. Bars represent the mean ± SEM compared to the control group (p < 0.0001). Statistical significance represented by ** p ≤ 0.01, and **** p ≤ 0.0001.
Acknowledgments
This image is the copyrighted work of the attributed author or publisher, and
ZFIN has permission only to display this image to its users.
Additional permissions should be obtained from the applicable author or publisher of the image.
Full text @ Foods