
- Title
-
Pneumolysin promotes host cell necroptosis and bacterial competence during pneumococcal meningitis as shown by whole-animal dual RNA-seq
- Authors
- Jim, K.K., Aprianto, R., Koning, R., Domenech, A., Kurushima, J., van de Beek, D., Vandenbroucke-Grauls, C.M.J.E., Bitter, W., Veening, J.W.
- Source
- Full text @ Cell Rep.
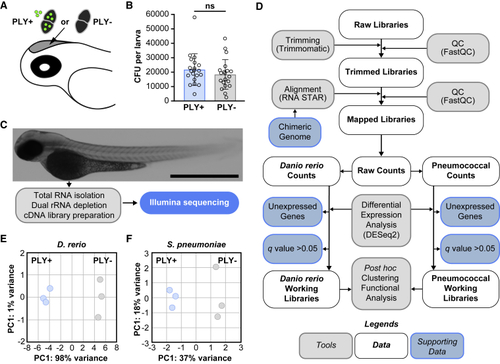
Dual RNA sequencing of host-pathogen transcriptomes in early pneumococcal meningitis (A) Zebrafish meningitis infection model. Pneumolysin-deficient S. pneumoniae D39V (PLY−) mutant bacteria or complemented S. pneumoniae D39V (PLY+) bacteria (∼2,000 CFUs) were injected into the hindbrain ventricle of 2 dpf zebrafish larvae. (B) Bacterial load in zebrafish larvae infected with S. pneumoniae PLY+ or S. pneumoniae PLY− at 8 hpi. The data represent the mean ± SD of two biological replicates with 9–10 larvae per group; each dot represents a single larva; ns, non-significant; determined by unpaired t test. (C) Total RNA was isolated from pooled infected zebrafish larvae (n = 100 per biological replicate) for preparation of cDNA libraries and sequencing at 8 hpi. Scale bar: 100 μm. (D) Quality control (QC) was performed on raw reads, low-quality reads were trimmed, and remaining reads were aligned to a synthetic chimeric genome. Aligned reads were counted and classified as pneumococcal or D. rerio counts. Final working libraries were created after removal of two gene fractions, and clustering and functional enrichment analysis were performed. (E) Principal-component (PC) analysis plot of pathogen transcriptional response to infection showed that the replicates cluster closely together. (F) PC analysis plot of host response showed similar clustering behavior. |

The host’s transcriptional response to infection with pneumolysin-positive or pneumolysin-negative S. pneumoniae D39V (A) Volcano plot from DESeq2 analysis of RNA pools from zebrafish larvae infected with the pneumolysin-deficient S. pneumoniae D39V mutant strain (PLY−) or the complemented S. pneumoniae D39V mutant strain (PLY+) at 8 hpi. The presence of pneumococcal pneumolysin activates a multitude of host genes in response to S. pneumoniae infection (FC > 1.5, q < 0.05). (B) Gene expression correlation between RNA sequencing (RNA-seq) and RT-qPCR data; each dot represents a single gene; correlation co-efficient (Pearson) and linear regression are indicated. (C) Gene Ontology enrichment analysis after DESeq2 analysis showed significant enrichment of several immunomodulatory pathways. Note that an individual gene can be part of multiple terms. (D) Gene set enrichment analysis after DESeq2 analysis showed enrichment of several immunomodulatory pathways in the presence of pneumolysin, whereas the phagolysosome pathway and many metabolic pathways were enriched in the absence of pneumolysin (FDR < 0.50). |

Inhibition of ripk3 increases mortality in zebrafish larvae with pneumococcal meningitis and attenuates neutrophil recruitment during early stages of pneumococcal meningitis (A) Gene expression analysis of ripk3 during early stages of pneumococcal meningitis. RT-qPCR was performed on pools of 20 zebrafish larvae injected with 2,000 CFUs of S. pneumoniae PLY+, S. pneumoniae PLY−, or PBS and collected at 3, 6, and 9 hpi. The data represent six biological replicates; F(1, 5) = 54.72, p = 0.0007, PLY+ versus control (CTRL) versus PLY− versus CTRL; determined by two-way ANOVA on log2-transformed values. Multiple comparison analyses of each individual time point showed no statistical differences between both groups: adjusted p = 0.9975, PLY+ versus CTRL versus PLY− versus CTRL at 3 hpi; adjusted p = 0.0676, at 6 hpi; adjusted p = 0.0829, at 9 hpi; determined by Sidak’s post hoc test on log2-transformed values. (B) Survival curves of 2 dpf zebrafish larvae injected with 200 CFUs of S. pneumoniae D39V into the hindbrain ventricle and control non-infected (ni) larvae treated with 100 μM GSK′872 or vehicle (DMSO). The data represent the mean ± SEM of three biological replicates with 20 larvae per group (n = 60 in total/group); ∗p = 0.0237; determined by log rank test. (C) Graph showing differences in number of neutrophils recruited to the hindbrain ventricle of zebrafish larvae injected with 2,000 CFUs of S. pneumoniae D39V upon treatment with 100 μM GSK′872 versus treatment with DMSO. The data represent the mean ± SEM of two biological replicates with 4–5 larvae per group (n = 9–10 in total/group); ∗∗∗∗p < 0.0001, GSK′872 (100 μM) versus vehicle (DMSO); determined by two-way ANOVA. (D) Representative confocal imaging of a single Z-slice of zebrafish larvae injected with 2,000 CFUs of red-fluorescently labeled S. pneumoniae into the hindbrain ventricle treated with 100 μM GSK′872 versus treatment with DMSO. Neutrophils are labeled by a GFP fusion to the mpx gene. Scale bar: 100 μm. (E) Graph of number of neutrophils recruited to the hindbrain ventricle of zebrafish larvae injected with 2,000 CFUs of S. pneumoniae PLY+ or S. pneumoniae PLY− and treatment with 100 μM GSK′872 versus treatment with DMSO. The data represent the mean ± SEM of two biological replicates with 5 larvae per group (n = 10 in total/group); ∗∗∗p = 0.0006, S. pneumoniae PLY+ (GSK′872, 100 μM) versus S. pneumoniae PLY+ (DMSO); p = 0.6441, S. pneumoniae PLY− (GSK′872, 100 μM) versus S. pneumoniae PLY− (DMSO); determined by two-way ANOVA. |

Cxcl18 expression in zebrafish larvae infected with pneumolysin-positive or pneumolysin-negative S. pneumoniae D39V (A) Top 20 highest significantly enriched genes in zebrafish infected with S. pneumoniae PLY+ or S. pneumoniae PLY− (q < 0.05). (B) Gene expression analysis of cxcl18b during early stages of pneumococcal meningitis. RT-qPCR was performed on pools of 20 zebrafish larvae injected with 2,000 CFUs of S. pneumoniae PLY+, S. pneumoniae PLY−, or control PBS injection and collected at 3, 6, and 9 hpi. The data represent four biological replicates; F(1, 6) = 44.21, ∗∗adjusted p = 0.0006, PLY+ versus CTRL versus PLY− versus CTRL; determined by two-way ANOVA on log2-transformed values; ∗∗p = 0.0063; determined by two-way ANOVA with Tukey’s post test on log2-transformed values. (C) Expression of Cxcl18b:EGFP is higher in zebrafish larvae (2 dpf) injected with 2,000 CFUs of S. pneumoniae PLY+ compared with infection with similar CFUs of S. pneumoniae PLY− or control PBS injection. Scale bar: 500 μm. (D) Quantification of Cxcl18b:EGFP expression in the head region over time. The data represent the mean ± SEM with 10 larvae per group; ∗∗∗∗p < 0.0001; determined by two-way ANOVA followed by Tukey’s post hoc test. |
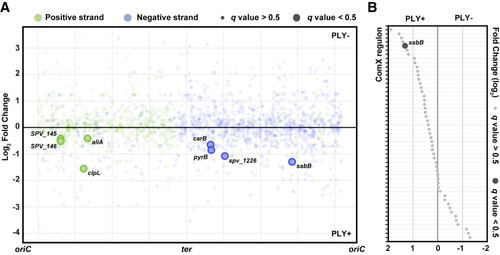
Transcriptional response in pneumolysin-positive or pneumolysin-negative S. pneumoniae D39V (A) Pneumolysin-specific transcriptional rewiring in S. pneumoniae in response to injection in zebrafish embryo. Fold change of transcriptional response in S. pneumoniae PLY+ and PLY− is plotted against its genomic location. (B) Fold change of ComX regulons between S. pneumoniae PLY+ and S. pneumoniae PLY− strains shows gene expression regulation in response to zebrafish infection. ssbB, a member of the regulon shows increased expression in S. pneumoniae PLY+ compared with S. pneumoniae PLY− (FC ≥ 2.0, q < 0.5). Regulons are sorted by fold change value in descending order. |
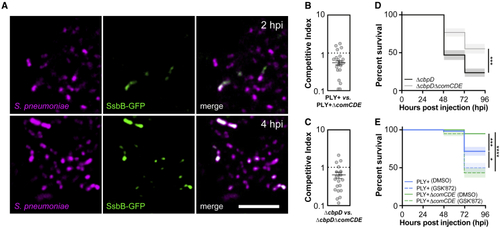
Pneumococcal competence in zebrafish larvae with pneumococcal meningitis (A) Single-plane confocal microscopy images showing increased heterogeneous expression of SsbB-GFP over time in constitutively HlpA-mCherry-expressing pneumococci injected into the hindbrain ventricle of 2 dpf zebrafish larvae. Scale bar: 10 μm. (B) Competitive index (CI) analysis of 2 dpf larvae co-injected with similar number of S. pneumoniae D39V PLY+ (HlpA-GFP) and S. pneumoniae D39V PLY+ ΔcomCDE (HlpA-mKate2) (B) and CI of larvae co-injected with similar number of S. pneumoniae D39V ΔcbpD and S. pneumoniae D39V ΔcbpDΔcomCDE. (C) Larvae were harvested at 24 hpi. A CI score of 1 denotes no difference in virulence. The data represent the mean ± SEM of two biological replicates with 10 larvae per group; each dot represents a single larva; p < 0.0001, D39V PLY+ versus D39V PLY+ ΔcomCDE; p < 0.01, D39V ΔcbpD versus ΔcbpDΔcomCDE; determined by one sample t test. (D) Survival curves of 2 dpf zebrafish larvae injected with 400 CFUs of S. pneumoniae D39V PLY+ or S. pneumoniae D39V PLY+ ΔcomCDE into the hindbrain ventricle. The data represent the mean ± SEM of three biological replicates with 20 larvae per group (n = 60 in total/group); ∗∗∗p = 0.0001; determined by log rank test. (E) Survival curves of 2 dpf zebrafish injected with 300 CFUs of S. pneumoniae D39V PLY+ or S. pneumoniae D39V PLY+ ΔcomCDE into the hindbrain ventricle and treatment with 100 μM GSK′872 (RIPK3 inhibitor) or vehicle (DMSO). The data represent the mean ± SEM of three biological replicates with 20 larvae per group (n = 60 in total/group); ∗p = 0.0177, ∗∗∗p = 0.0006, ∗∗∗∗p < 0.0001; determined by log rank test. |