
- Title
-
Resveratrol-Mediated Reversal of Doxorubicin-Induced Osteoclast Differentiation
- Authors
- Poudel, S., Martins, G., Cancela, M.L., Gavaia, P.J.
- Source
- Full text @ Int. J. Mol. Sci.
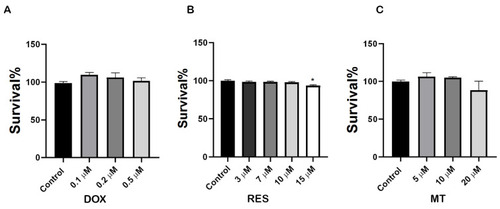
Cytotoxicity of doxorubicin and antioxidants on RAW 264.7 cells. RAW 264.7 cells were exposed to different concentrations of Doxorubicin (DOX) (A), Resveratrol (RES) (B) and MitoTEMPO (MT) (C) and an XTT assay was performed. Cells were treated for 3 days with RES and MT, and for 3 h with DOX. One-way ANOVA, Tukey’s multiple comparisons test, *—p ≤ 0.05. |
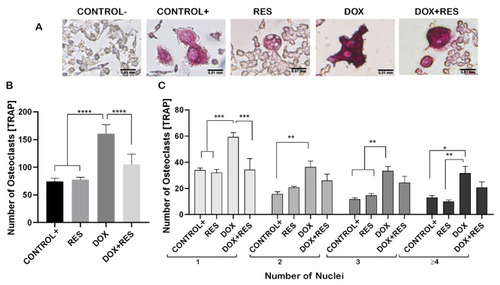
Resveratrol prevents doxorubicin-induced osteoclast differentiation. RAW 264.7 cells were cultured for 4 days with M-CSF (30 ng/mL) and RANKL (50 ng/mL) and treated with resveratrol (RES) and doxorubicin (DOX) alone or combined. TRAP-positive osteoclastic cells (A). Number of TRAP-positive cells (B). Number nuclei in TRAP-positive cells from the different treatments. Cells were grouped according to the number of nuclei: 1, 2, 3 or more than 4 (≥4) (C). One-way ANOVA, Tukey’s multiple comparisons test, *—p ≤ 0.05, **—p ≤ 0.01, ***—p ≤ 0.001, ****—p ≤ 0.0001. |
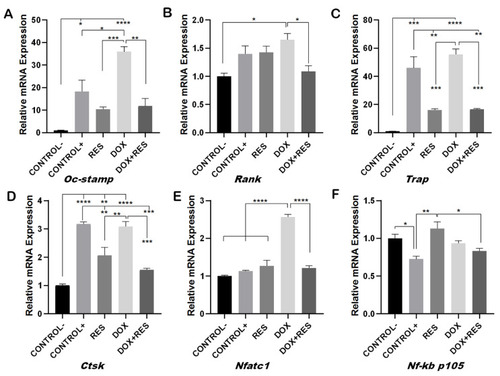
Inhibition of doxorubicin-induced osteoclast differentiation by resveratrol. RAW 264.7 cells were cultured for 4 days with M-CSF (30 ng/mL) and RANKL (50 ng/mL) and treated with resveratrol (RES) and doxorubicin (DOX) alone or combined. Levels of mRNA expression for Oc-stamp (A), Rank (B) Trap (C), Ctsk (D), Nfatc1 (E) and Nf-kb p105 (F) were analyzed by qPCR. One-way ANOVA, Tukey’s multiple comparisons test, *—p ≤ 0.05, **—p ≤ 0.01, ***—p ≤ 0.001, ****—p ≤ 0.0001. |
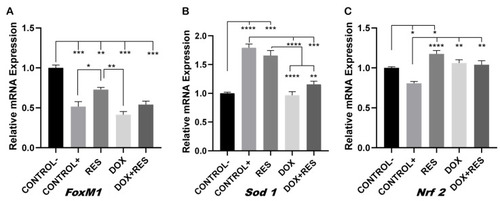
Involvement of FoxM1 on osteoclast differentiation and oxidative stress. RAW 264.7 cells were cultured for 4 days with M-CSF (30 ng/mL) and RANKL (50 ng/mL) and treated with resveratrol (RES), MitoTEMPO (MT) and doxorubicin (DOX) alone or together. RNA from the cells was obtained, and expression levels for FoxM1 (A), Sod 1 (B) and Nrf 2 (C) were analyzed by qPCR. One-way ANOVA, Tukey’s multiple comparisons test, *—p ≤ 0.05, **—p ≤ 0.01, ***—p ≤ 0.001, ****—p ≤ 0.0001. |

Effect of MitoTEMPO on doxorubicin-induced osteoclast differentiation. RAW 264.7 cells were cultured for 4 days with M-CSF (30 ng/mL) and RANKL (50 ng/mL) and treated with MitoTEMPO (MT) and Doxorubicin (DOX) alone or together. The cells were stained for TRAP (A). The number of TRAP-positive cells (B). Cells were grouped according to number of nuclei: 1, 2, 3 or more than 4 (≥4) (C). One-way ANOVA, Tukey’s multiple comparisons test, *—p ≤ 0.05, **—p ≤ 0.01, ***—p ≤ 0.001, ****—p ≤ 0.0001. |
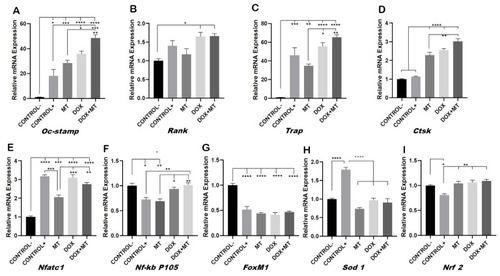
Effect of MitoTEMPO on doxorubicin-induced osteoclast differentiation and oxidative stress markers. RAW264.7 cells were cultured for 4 days with M-CSF (30 ng/mL) and RANKL (50 ng/mL) and treated with MitoTEMPO (MT) and Doxorubicin (DOX) alone or together. Levels of expression for Oc-stamp (A), Rank (B), Trap (C), Ctsk (D), Nfatc1 (E), Nf-kb p105 (F), FoxM1 (G), Sod1 (H) and Nrf 2 (I) were analyzed by qPCR. One-way ANOVA, Tukey’s multiple comparisons test, *—p ≤ 0.05, **—p ≤ 0.01, ***—p ≤ 0.001, ****—p ≤ 0.0001. |
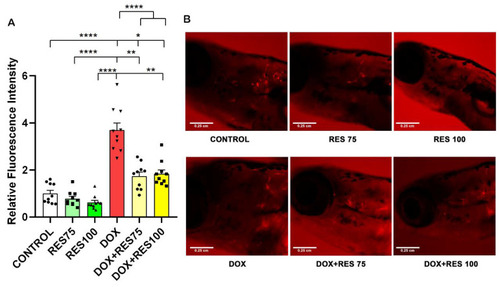
Inhibitory effect of resveratrol on doxorubicin-induced stimulation of osteoclasts. The ctsk reporter zebrafish transgenic line (Tg[ctsk:DsRed]) at 25 dpf was exposed to different concentrations of resveratrol (RES, 75 µM and 100 µM) alone or together with Doxorubicin (DOX, 17.2 µM) for 96 h and ctsk signal was measured in the head area. Quantification of fluorescence intensity between the treatment groups performed using fluorescent images acquired with the same parameters and analyzed with ImageJ (A), and ctsk-positive cells in the head of fish from the different treatment groups (B). One-way ANOVA, Tukey’s multiple comparisons test, *— p ≤ 0.05, **—p ≤ 0.01, ****—p ≤ 0.0001. EXPRESSION / LABELING:
PHENOTYPE:
|
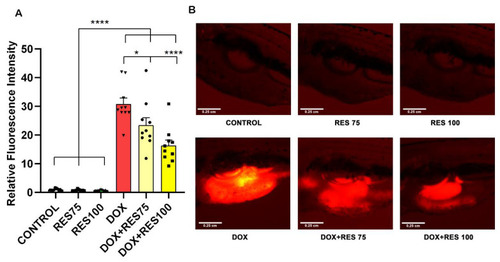
Reversal of Doxorubicin-induced mucositis by resveratrol. The ctsk reporter zebrafish transgenic line (Tg[ctsk:DsRed]) was exposed to different concentrations of resveratrol (RES, 75 µM and 100 µM) alone or together with doxorubicin (DOX, 17.2 µM) for 96 h. The quantification of fluorescence intensity between the treatment groups performed using fluorescent images acquired with the same parameters and analyzed with ImageJ (A). ctsk signal in the abdominal area of fish from the different treatment groups (B). One-way ANOVA, Tukey’s multiple comparisons test, *—p ≤ 0.05, ****—p ≤ 0.0001. EXPRESSION / LABELING:
PHENOTYPE:
|
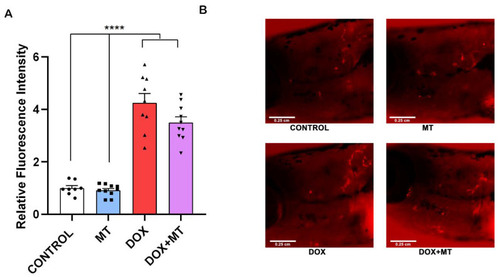
Effect of MitoTEMPO on doxorubicin-induced stimulation of ctsk cells. The ctsk reporter zebrafish transgenic line (Tg[ctsk:DsRed]) at 25 dpf was exposed to MitoTEMPO (MT, 20 µM) alone or together with doxorubicin (DOX, 17.2 µM) for 96 h. Quantification of fluorescence intensity between the treatment groups (A) and the ctsk signal in the head area of fish from the different treatment groups (B). One-way ANOVA, Tukey’s multiple comparisons test, ****—p ≤ 0.0001. EXPRESSION / LABELING:
PHENOTYPE:
|
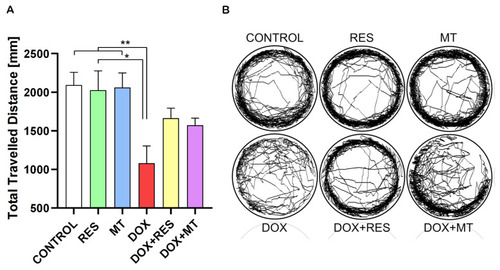
Effect of doxorubicin on locomotor activity of zebrafish post-larvae. Ctsk reporter zebrafish transgenic line (Tg(ctsk:DsRed)) were exposed to different concentrations of resveratrol (RES), MitoTEMPO (MT) alone or together with doxorubicin (DOX) for 24 h. Locomotor activity was measured on Zantiks MWP system. Total distance travelled with RES (100 µM), MT (20 µM) and DOX (17.2 µM) alone or together (A). The locomotory pattern of fish between the treatment groups (B). One-way ANOVA, Tukey’s multiple comparisons test, *—p ≤ 0.05, **—p ≤ 0.01. |