
- Title
-
In Silico Study and Effects of BDMC33 on TNBS-Induced BMP Gene Expressions in Zebrafish Gut Inflammation-Associated Arthritis
- Authors
- Mostofa, F., Yasid, N.A., Shamsi, S., Ahmad, S.A., Mohd-Yusoff, N.F., Abas, F., Ahmad, S.
- Source
- Full text @ Molecules
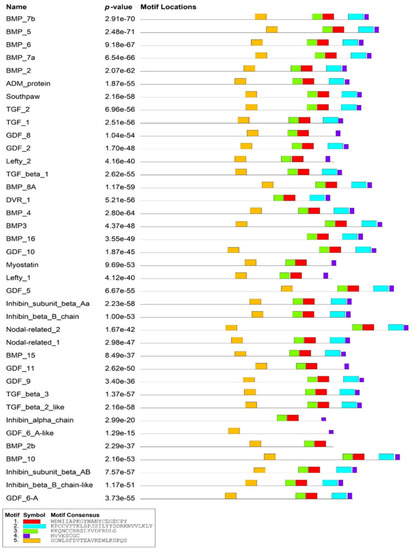
Domain organisation of 38 BMP family members. Five consensus sequences of TGF motifs were identified in these proteins. Red, cyan, and green boxes indicate TGF beta peptide domains. Yellow box indicates TGF beta pro peptide domain. TGF = Transforming growth factor. |
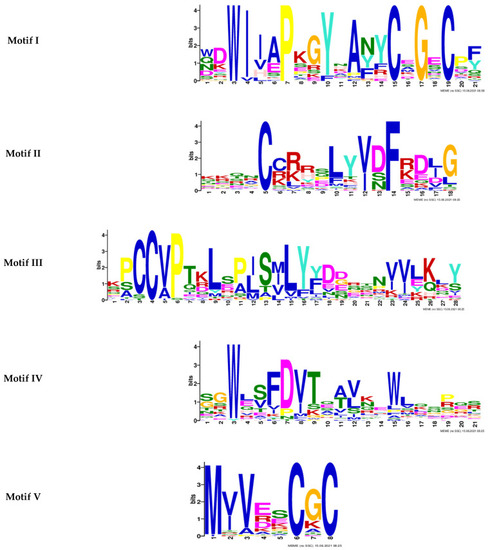
Sequence logo of five motifs predicted from the 38 BMP family proteins of zebrafish. Cysteine, glycine, and phenylalanine residues were identified to be prominent in the motifs. |
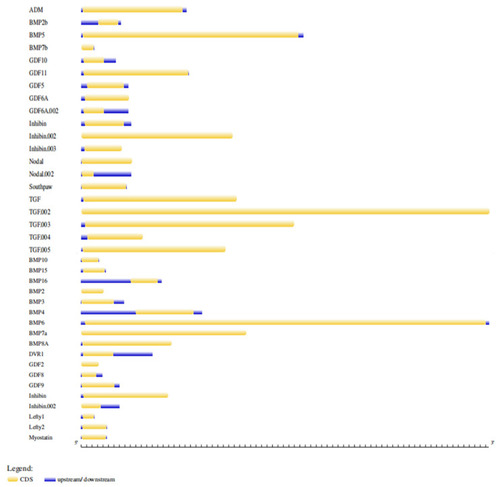
Gene structure of 38 zebrafish BMP sequences. ADM = Adrenomedullin, BMP = Bone morphogenic protein, GDF = Growth differentiation factor, TGF = Transforming growth factor, DVR1 = decapentaplegic-Vg-related 1, and Lefty = Left-right determination factor. |
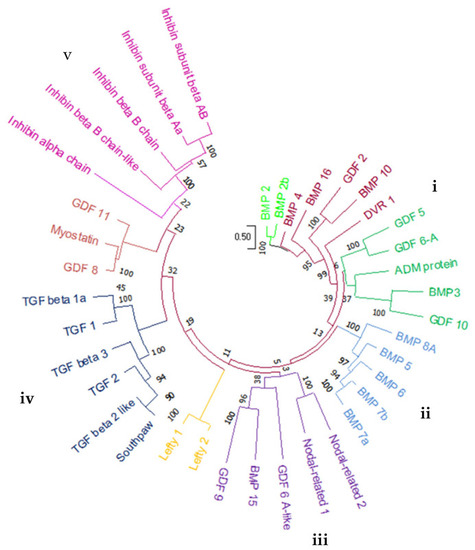
Phylogenetic relationship of 38 BMP members identified in zebrafish genome. Phylogenetic tree was produced using a maximum likelihood (ML) method with 1000 bootstrap replicates in MEGA-X software. I–V represent five major clades. |
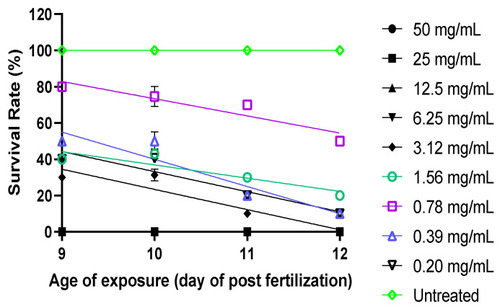
Survival rate of zebrafish larvae (9 to 12 dpf) exposed to TNBS at two-fold serial dilution (0.2–50 mg/mL). Zebrafish larvae at 12 dpf survived (>60%) in TNBS at concentration <0.78 mg/mL. |
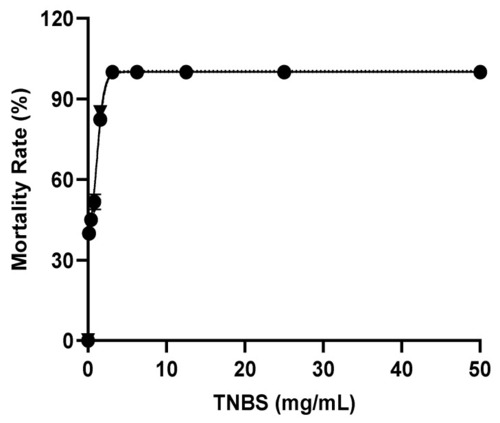
Effect of TNBS at concentrations of 0.2–50 mg/mL on zebrafish larvae (12 dpf) mortality rate. The LC50 value of TNBS was 0.60 mg/mL. |
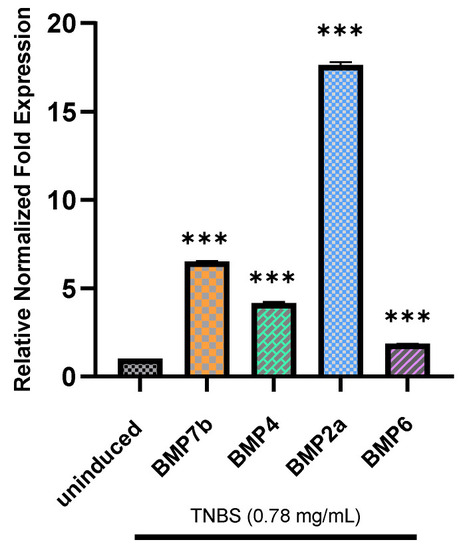
Relative normalized expression of BMP7b, |
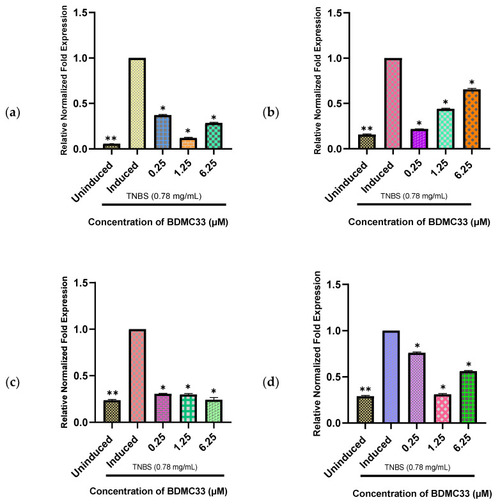
Relative normalized fold expression in (a) BMP2a, (b) BMP7b, (c) BMP4, and (d) BMP6 genes induced with 0.78 mg/mL of TNBS and treated with BDMC33 at three different concentrations (0.25, 1.25, and 6.25 μM). Thirty 12-day-old larvae were pooled from each of the uninduced, TNBS-induced, and TNBS-induced with treatment (BDMC33) groups for total RNA extraction. All genes were normalized against two reference genes: GAPDH and β actin. Data are expressed as the mean ± S.E.M. of three replicates. Values of * p < 0.05 and ** p < 0.01 were considered significantly different from the induced group. |