
Image
|
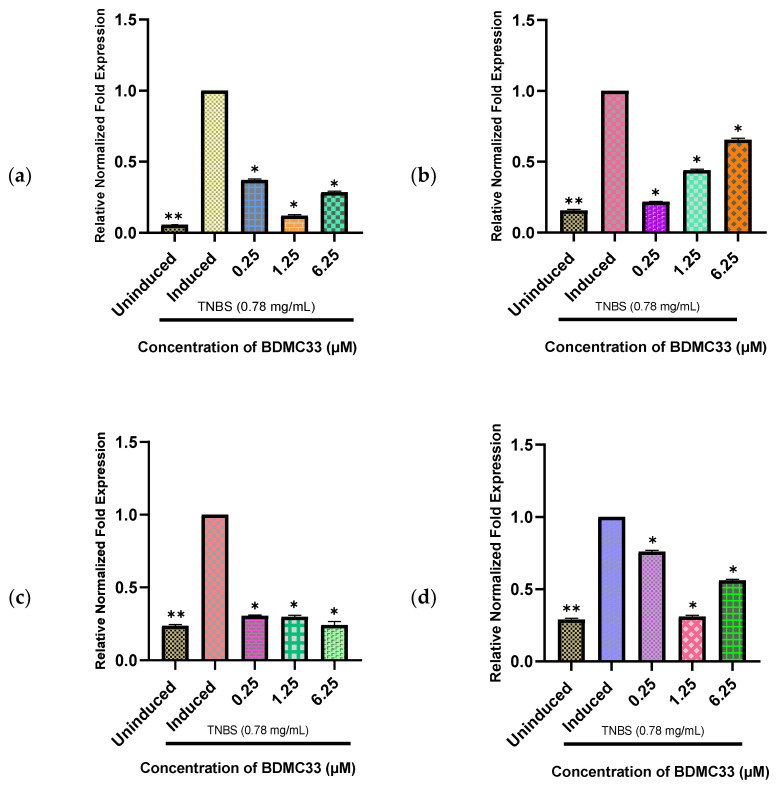
Figure Caption
Figure 8
Relative normalized fold expression in (a) BMP2a, (b) BMP7b, (c) BMP4, and (d) BMP6 genes induced with 0.78 mg/mL of TNBS and treated with BDMC33 at three different concentrations (0.25, 1.25, and 6.25 μM). Thirty 12-day-old larvae were pooled from each of the uninduced, TNBS-induced, and TNBS-induced with treatment (BDMC33) groups for total RNA extraction. All genes were normalized against two reference genes: GAPDH and β actin. Data are expressed as the mean ± S.E.M. of three replicates. Values of * p < 0.05 and ** p < 0.01 were considered significantly different from the induced group.
Acknowledgments
This image is the copyrighted work of the attributed author or publisher, and
ZFIN has permission only to display this image to its users.
Additional permissions should be obtained from the applicable author or publisher of the image.
Full text @ Molecules