
- Title
-
The calcium-sensing receptor (CaSR) regulates zebrafish sensorimotor decision making via a genetically defined cluster of hindbrain neurons
- Authors
- Shoenhard, H., Jain, R.A., Granato, M.
- Source
- Full text @ Cell Rep.
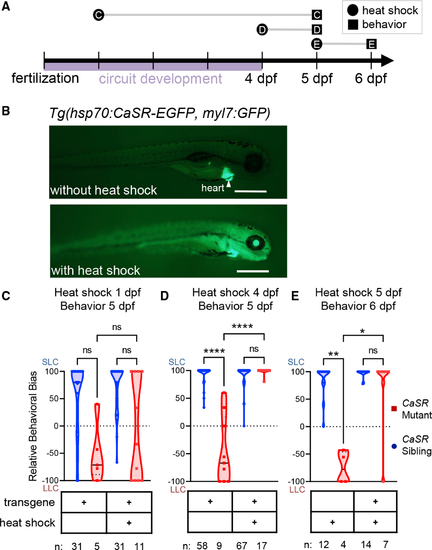
CaSR expression after development of behaviorally relevant circuits is sufficient to restore decision making in CaSR mutants
(A) Timeline of zebrafish escape and reorientation circuit development. Both behaviors have emerged by 4 dpf. Letters correspond to panels in this figure. Circles indicate time of heat shock; squares indicate time of behavioral testing. (B) Fluorescent image of Tg(hsp70:CaSR-EGFP, myl7:GFP) larva without (top) and with (bottom) heat shock. Arrow indicates heart label used for embryo pre-sorting. Scale bar represents 500 um. (C) Average relative startle bias of 5 days post-fertilization (dpf) sibling and mutant Tg(hsp70:CaSR-EGFP,myl7:GFP) larvae subject to no heat shock or to heat shock at 1 dpf. Blue circles indicate CaSR WT and heterozygous siblings; red squares indicate CaSR homozygous mutants. n.s. incidates p > 0.05. (D) Average relative startle bias of 5 days post-fertilization (dpf) sibling and mutant Tg(hsp70:CaSR-EGFP,myl7:GFP) larvae subject to no heat shock or to heat shock at 4 dpf. Results are from three experiments. **** incidates p < 0.0001. n.s. incidates p>0.05. (E) Average relative startle bias of 6 dpf sibling and mutant Tg(hsp70:CaSR-EGFP,myl7:GFP) larvae subject to no heat shock or to heat shock at 5 dpf. No transgene control siblings vs. mutants p = 0.007. No transgene control vs. transgenic mutants, p = 0.0145. n.s. incidates p > 0.05. In (C), (D), and (E), solid lines indicate median; dashed lines indicate quartiles. All p values in (C), (D), and (E) are from Kruskal-Wallis test with Dunn’s multiple comparisons post hoc test. |
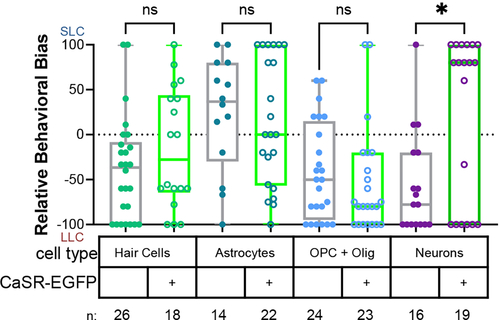
Transgenic CaSR expression in neurons, but not other cell types, restores decision making in CaSR mutants
Relative behavioral bias of CaSR mutant larvae either not expressing (filled circle, gray box and whiskers) or expressing (empty circle, green box and whiskers) UAS:CaSR-EGFP in the indicated cell type. Cyan, hair cells; dark blue, astrocytes; sky blue, OPCS and oligodendrocytes; purple, neurons. CaSR-EGFP negative control larvae vs. neuronal CaSR-EGFP larvae p = 0.0168. n.s. indicates p > 0.05. Lines indicate median; box extends from 25th to 75th percentile. p values are from Kruskal-Wallis test with Dunn’s multiple comparisons post hoc test. |
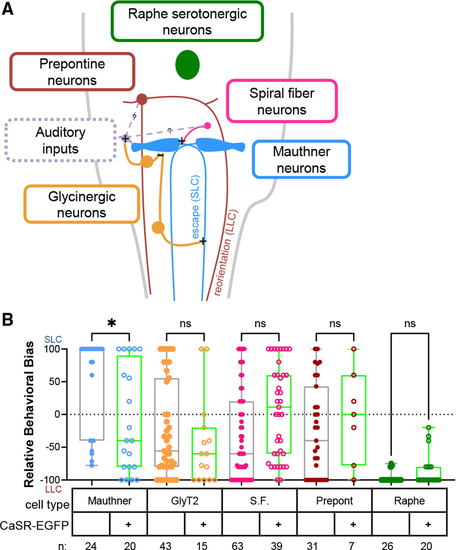
CaSR re-expression in known escape (SLC) and reorientation (LLC) circuit components fails to rescue decision making in CaSR mutants
(A) Diagram of circuit relationships of SLC and LLC circuit components. Blue, Mauthner; orange, glycincergic neurons including feedforward and feedback inhibitory neurons; pink, spiral fiber feedforward excitatory neurons; brick red, prepontine LLC-mediating neurons; green, serotonergic neurons of the Raphe. (B) Relative behavioral bias of CaSR mutant larvae either not expressing (filled circle, gray box and whiskers) or expressing (empty circle, green box and whiskers) UAS:CaSR-EGFP in the indicated cell type. Colors as in (A). CaSR-EGFP negative control larvae versus Mauthner CaSR-EGFP larvae p = 0.0294; note that these larvae were shifted toward reorientations, the opposite direction expected from behavioral rescue. n.s. indicates p > 0.05. Lines indicate median, box extends from 25th to 75th percentile. p values are from Kruskal-Wallis test with Dunn’s multiple comparisons post hoc test. |
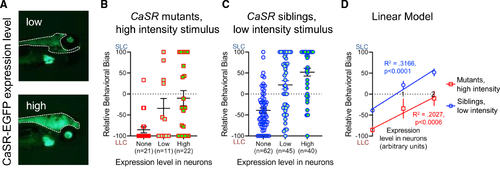
Neuronal CaSR expression shifts decision making in CaSR mutants and siblings in a dose-dependent manner
(A) Brains and rostral spinal cords of larvae expressing CaSR-EGFP under control of the αTub:Gal4 driver, outlined with white dashed line. Since the αtubulin:Gal4 line also includes a myl7:GFP marker, green hearts are also visible. Top, representative example of a fish from the “low expression” category. Bottom, representative example of a fish from the “high expression” category. (B) Relative behavioral bias in response to strong acoustic stimuli of CaSR mutants not expressing any CaSR-EGFP (no fill), manually sorted into the “low expression” category (light green fill), or manually sorted into the “high expression” category (bright green fill). Lines represent means +/− SEM. (C) Relative behavioral bias in response to weak acoustic stimuli of CaSR siblings not expressing any CaSR-EGFP (no fill), manually sorted into the “low expression” category (light green fill), or manually sorted into the “high expression” category (bright green fill). Lines represent means +/− SEM. (D) Univariate linear models of effects of CaSR-EGFP expression levels in neurons on relative behavioral bias. For the X axis, arbitrary units were used, with 0 corresponding to no CaSR-EGFP expression, 1 to low CaSR-EGFP expression, and 2 to high CaSR-EGFP expression. Red squares, CaSR mutants (from B). Blue circles, CaSR siblings (from C). Mutant linear model slope significantly different from 0, p = 0.0006; R2 = 0.2027. Sibling linear model slope significantly different from 0, p < 0.0001; R2 = 0.3166. |
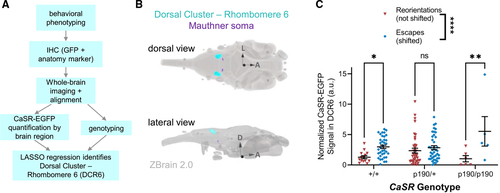
Multivariate analysis of variegated expression in neurons (MAVEN) identifies a hindbrain region where CaSR overexpression correlates with decision-making phenotype
(A) Experimental workflow for MAVEN experiment. (B) Location of the dorsal cluster rhombomere 6 (cyan), relative to the Mauthner soma (purple), in rhombomere 4. Image generated using ZBrain 2.0’s 3D Viewer tool (https://zebrafishatlas.zib.de/). (C) Normalized fluorescence intensity signal in the dorsal cluster rhombomere 6 in brightly expressing αtubulin:Gal4; UAS:CaSR-EGFP; CaSRp190/+ larvae of various CaSR genotypes that were SLC-shifted in response to a weak, primarily LLC-evoking stimulus. Two-way ANOVA column factor (phenotype) p < 0.0001. Non-shifted vs. escape-shifted wild-type larvae p = 0.0462. Non-shifted vs. escape-shifted mutant larvae p = 0.0027. n.s. indicates p > 0.05. Multiple comparisons were controlled using Sidak’s multiple comparison’s test. Lines represent mean +/− SEM. |
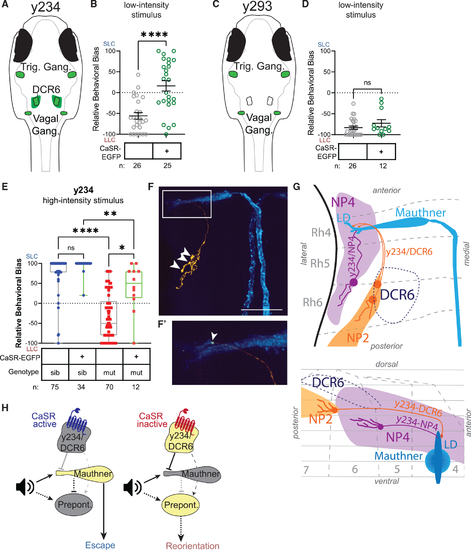
The y234/DCR6 is a key site for CaSR-dependent decision making
(A) Cartoon of trigeminal ganglion, vagal ganglion, and DCR6 expression driven by the y234:Gal4 line. All expression patterns are based on images from ZBrain 2.0 brain browser; trigeminal ganglion from slice 35, vagal ganglion from slice 40, and Rhombencephalon QRFP Cluster Sparse (DCR6) from slice 120. (B) Relative behavioral bias in response to weak stimuli of larvae generated by crossing Et(y234:Gal4) × Tg(UAS:CaSR-EGFP); CaSRp190/+ adults. p < 0.0001, Mann-Whitney U test. Lines represent means +/− SEM. (C) Cartoon of trigeminal and vagal ganglion expression driven by the y293:Gal4 line. (D) Relative behavioral bias in response to weak stimuli of CaSR sibling larvae generated by crossing Et(y293:Gal4); UAS:CaSR-EGFP; CaSRp190/+ × Tg(UAS:CaSR-EGFP); CaSRp190/+ adults. p = 0.2234, Mann-Whitney U test. Lines represent means +/− SEM. (E) Relative behavioral bias in response to strong stimuli of CaSR sibling and mutant larvae generated by crossing Et(y234:Gal4); UAS:CaSR-EGFP; CaSRp190/+ × Tg(UAS:CaSR-EGFP); CaSRp190/+ adults. p = 0.0392, mutants with vs. without CaSR-EGFP expression, Kruskal-Wallis with Dunn’s post hoc test. (F) Maximum projection of Et(y234:Gal4); Tg(hsp70GFF62a:Gal4); Tg(UAS:gap43-citrine) larvae with sparse expression in the y234/DCR6. The Mauthner (blue) and y234/DCR6 neurons (orange) have been pseudocolored to allow clear visualization of the y234/DCR6 axon that projects dorsally and across the Mauthner lateral dendrite, where it eventually terminates. Three cell bodies in the y234/DCR6 are demarcated with white arrows. Scale bar represents 50 um. (F′) zoomed image of the pseudocolored Mauthner lateral dendrite (blue) with arrow demarcating a possible axon terminal bouton from y234/DCR6 neurons (orange). (G) Top view and side view of the brain spanning from the DCR6 (most dorsal, purple outline) to the Mauthner neuron (most ventral, blue) including neuropil region 2 (NP2, orange), neuropil region 4 (NP4, magenta), and two projections to the Mauthner lateral dendrite labeled by y234:Gal4. The y234/DCR6 projection originates in neuropil 2, proximal to the ZBrain-defined DCR6, and was observed in 6/13 larvae in the sparse labeling experiment in (F), including the larva pictured in (F). The y234/NP4 projection originates in neuropil 4, lateral to the ZBrain-defined DCR6, and was observed in 4/13 larvae in the sparse labeling experiment in (F). Rhombomeres are labeled by number. Dashed lines in the lateral view indicate approximately 10-μm increments. All anatomy is based on the ZBrain 2.0 atlas and sparse labeling experiments. (H) Proposed model of how CaSR signaling in the y234/DCR6 modulates the escape versus reorientation decision-making circuit. Yellow, more active brain region/neuron. Gray, less active brain region/neuron/synapse. Dashed lines indicate indirect or uncharacterized synaptic connections. T bars indicate inhibitory connections. Left: when CaSR activity in the y234/DCR6 is high, y234/DCR6 activity is high. High DCR6 activity dampens Mauthner activity, freeing prepontine neurons from inhibition and resulting in reorientation behaviors. The y234/DCR6 may also excite prepontine reorientation-mediating neurons, although we did not identify a projection from the y234/DCR6 to the prepontine region. Right: when CaSR activity in the y234/DCR6 is high, y234/DCR6 activity is low. Low y234/DCR6 activity frees the Mauthner lateral dendrite from inhibition, allowing the Mauthner to initiate escapes while simultaneously inhibiting initiation of the less-prioritized behavior, reorientations. Right: when CaSR activity in the y234/DCR6 is low, y234/DCR6 activity is high. High y234/DCR6 activity dampens Mauthner lateral dendrite activation by acoustic stimuli, freeing prepontine neurons from inhibition and resulting in reorientation behaviors. |