
|
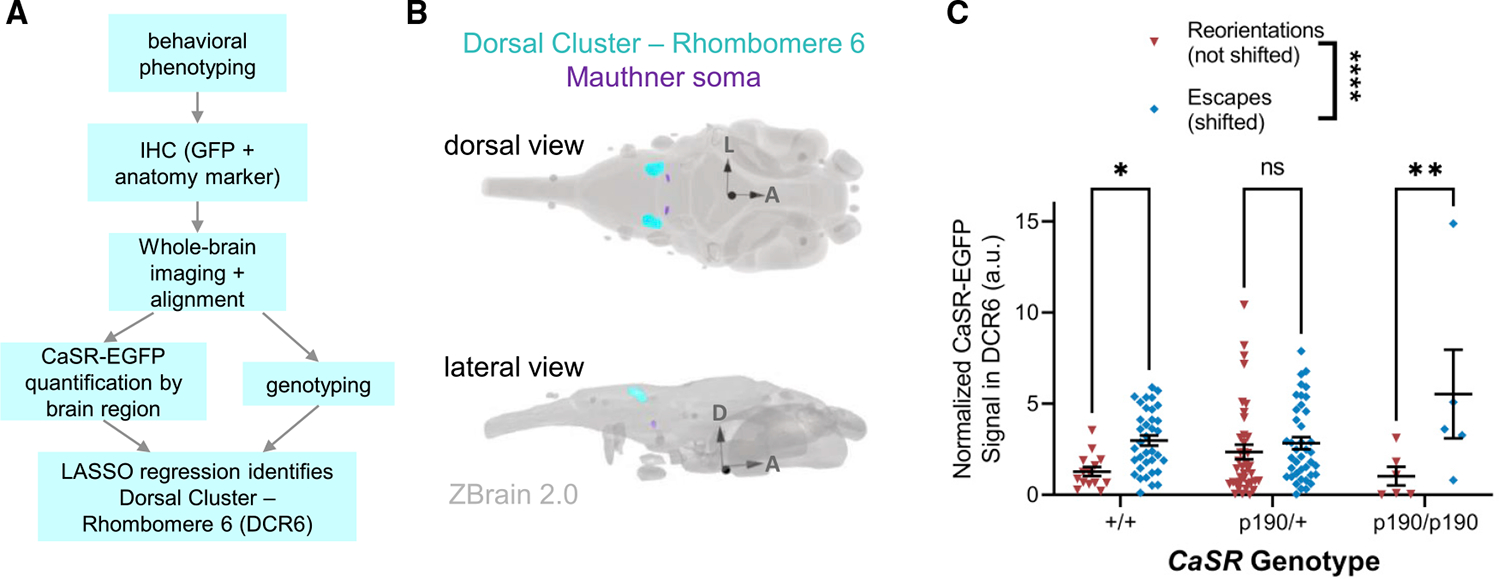
Fig. 5
(A) Experimental workflow for MAVEN experiment.
(B) Location of the dorsal cluster rhombomere 6 (cyan), relative to the Mauthner soma (purple), in rhombomere 4. Image generated using ZBrain 2.0’s 3D Viewer tool (https://zebrafishatlas.zib.de/).
(C) Normalized fluorescence intensity signal in the dorsal cluster rhombomere 6 in brightly expressing αtubulin:Gal4; UAS:CaSR-EGFP; CaSRp190/+ larvae of various CaSR genotypes that were SLC-shifted in response to a weak, primarily LLC-evoking stimulus. Two-way ANOVA column factor (phenotype) p < 0.0001. Non-shifted vs. escape-shifted wild-type larvae p = 0.0462. Non-shifted vs. escape-shifted mutant larvae p = 0.0027. n.s. indicates p > 0.05. Multiple comparisons were controlled using Sidak’s multiple comparison’s test. Lines represent mean +/− SEM.