
- Title
-
Modeling the effects of genetic and diet induced obesity on melanoma progression in zebrafish
- Authors
- Montal, E., Lumaquin, D., Ma, Y., Suresh, S., White, R.M.
- Source
- Full text @ Dis. Model. Mech.
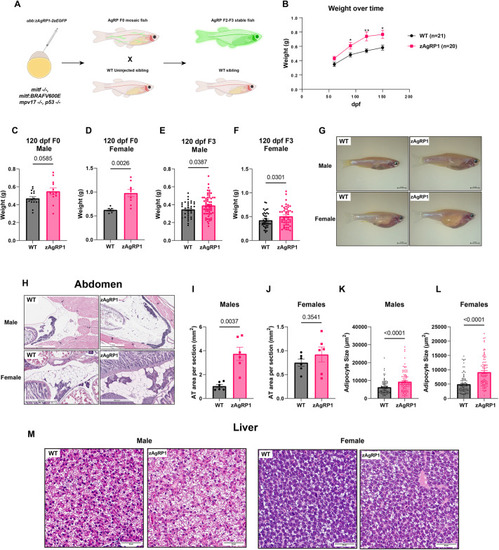
Agrp overexpression promotes obesity in casper zebrafish. (A) Schematic of generation of zebrafish agrp cDNA (zAgRP1)-overexpressing casper zebrafish (mitfa:BRAFV600E, p53−/−, mitfa−/−, mpv17−/−). Created with Biorender.com. WT, wild type. (B) Weight of both male and female F0 fish combined over 6 months. (C,D) Weights of male (C) and female (D) F0 mosaic fish at 120 days post-fertilization (dpf). Fish were separated into equal numbers at 1 month, and their weights were measured at the indicated time points. n=5-10 fish per genotype per biological replicate. Data are the averages of three biological replicates. (E,F) Weights of male (E) and female (F) fish of the F3 stable line at 120 dpf. Data are the weights of all the fish from two clutches from separate single male and female pairs of fish across six separate tanks. n=35-60 fish per group. zAgRP1 fish and wild-type siblings were housed in the same tanks and identified via GFP fluorescence. (G) Representative images of male and female zAgRP1 fish and wild-type siblings. (H) Histology of abdomen from 7-month-old F3 male and female zAgRP1 or wild-type siblings. Representative images are shown. Fish were fixed in PFA, sectioned and stained with H&E. (I,J) Quantification of adipose tissue (AT) per section from male (I) and female (J) fish. Three fish per sex per genotype and two sections per fish were analyzed. (K,L) Quantification of individual adipocyte size of male (K) and female (L) fish. (M) Histology of liver from 7-month-old male F3 male and female fish. Fish were fixed in PFA, sectioned and stained with H&E. Three fish per genotype per sex were sectioned for histology. *P≤0.05, **P≤0.01. Welch's t-test. Scale bars: 5 mm (G), 1 mm (H, top row), 500 μm (H, bottom row), 50 μm (M). |
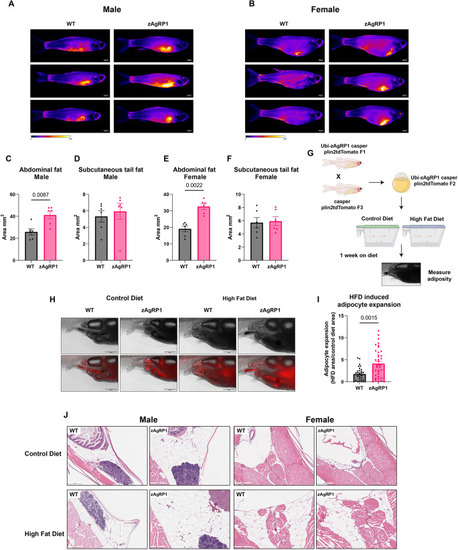
Agrp overexpression increases visceral adiposity and susceptibility to high-fat diet (HFD). (A,B) Representative images of male (A) and female (B) BODIPY-stained fish. (C-F) Quantification of visceral abdominal (C,E) and subcutaneous (D,F) fat depots from BODIPY-stained male (C,D) and female (E,F) fish. n=6 fish per condition over three biological replicates. (G) Schematic of Plin2tdTomato HFD experiment. 21 dpf zAgRP1 or wild-type Plin2tdTomato fish were put on either a control diet or HFD for 1 week, and visceral adiposity was measured. Created with Biorender.com. (H) Representative images of Plin2tdTomato fish. (I) Quantification of adipocyte expansion. HFD-induced adipocyte expansion was calculated by taking the ratio of the area of adipocyte tissue on the control diet versus HFD for each genotype. n≥30 fish per genotype across three biological replicates. (J) Histology of cross-sections of male and female adult quad zAgRP1 fish or wild-type controls on an HFD or control diet for 3 months. Fish were fixed in PFA, sectioned and stained with H&E. Two fish per condition were sent for sectioning. Mann–Whitney test. Scale bars: 2.5 mm (A,B), 500 μm (H,J). |
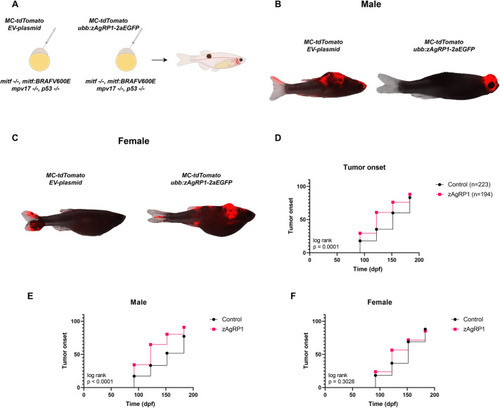
Agrp overexpression increases tumor onset in an embryo injection model of melanoma. (A) Schematic of embryo injection experiment to determine tumor onset with and without zAgRP1. Created with Biorender.com. (B,C) Representative images of male (B) and female (C) fish with tumors from empty vector (EV) control or zAgRP1 overexpression. (D) Tumor onset of MiniCoopR-rescued male and female fish combined. (E,F) Tumor onset of MiniCoopR-rescued male (E) and female (F) fish separated from D. Fish were injected at the one-cell stage and monitored for tumors at the indicated time points starting at 3 months post-fertilization (mpf). Data are the averages of three biological replicates. Log-rank (Mantel-Cox) . |
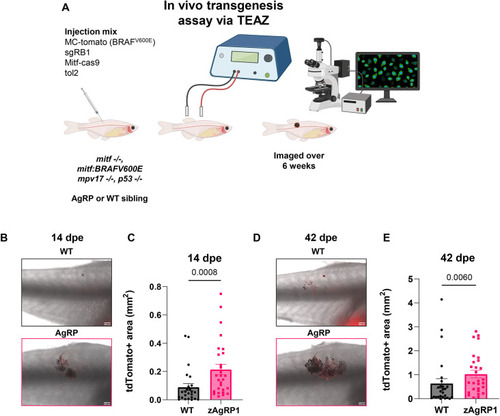
Obesity increases tumor initiation and area in an electroporation model of Rb1 mutant melanoma. (A) Schematic of in vivo transgenesis assay via Transgene Electroporation in Adult Zebrafish (TEAZ). Adult casper (mitfa:BRAFV600E, p53−/−, mitfa−/−, mpv17−/−) zAgRP1 or wild-type F0 fish were injected with MiniCoopR-tdTomato, sgRB1, mitfa:Cas9 and tol2 constructs and then electroporated. Fish were analyzed for tumor initiation and area by fluorescence microscopy over 6 weeks. Created with Biorender.com. (B,C) Tumor area at 14 days post-electroporation (dpe). Representative images (B) and quantification (C) of wild-type and zAgRP1 fish. (D,E) Tumor area at 42 dpe. Representative images (D) and quantification (E) of wild-type and zAgRP1 fish. n≥25 per genotype. Data are the averages of three biological replicates. Mann–Whitney test. Scale bars: 500 μm. |
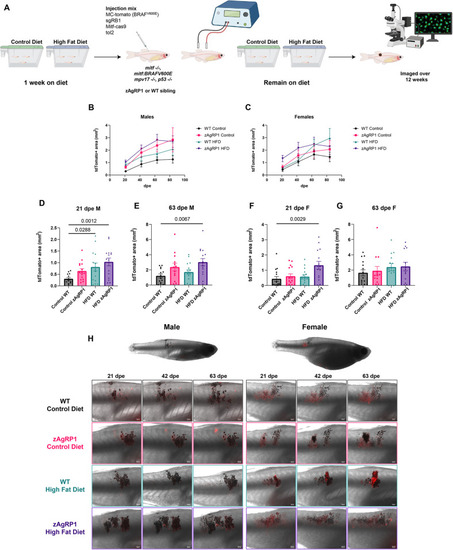
Obesity increases tumor growth in a sex-dependent manner in Rb1 mutant melanoma. (A) Schematic of in vivo transgenesis assay via TEAZ with the addition of an HFD. Fish were put on a control diet or HFD for 1 week. Adult casper (mitfa:BRAFV600E, p53−/−, mitfa−/−, mpv17−/−) zAgRP1 or wild-type F3 fish were injected with MiniCoopR-tdTomato, sgRB1, mitfa:Cas9 and tol2 constructs and then electroporated. Fish were analyzed for tumor initiation and area by fluorescence microscopy over 12 weeks while they remained on their respective diets. Created with Biorender.com. (B,C) Tumor growth as measured by tdTomato+ area over time. TdTomato+ area of lesions on zAgRP1 or wild-type male (B) and female (C) fish at indicated dpe. Growth curves were analyzed via mixed-effects analysis, with P=0.0344 significance when comparing the different conditions in males and P=0.2391 in females. (D,E) tdTomato+ area for early (21 dpe; D) and late (63 dpe; E) lesions in male zAgRP1 or wild-type fish on either a control diet or HFD. (F,G) tdTomato+ area for early (21 dpe; F) and late (63 dpe; G) lesions in female zAgRP1 or wild-type fish on either a control diet or HFD. (H) Representative fluorescence overlaid on brightfield images of lesions in male and female fish at the indicated time dpe. Representative images were chosen based on numerical values closest to the mean for each condition. n=14 fish per condition per sex. Data are the averages of three biological replicates. Dunnett's multiple comparisons test. Scale bars: 500 μm. |