
- Title
-
PP2A methylesterase PME-1 suppresses anoikis and is associated with therapy relapse of PTEN-deficient prostate cancers
- Authors
- Aakula, A., Isomursu, A., Rupp, C., Erickson, A., Gupta, N., Kauko, O., Shah, P., Padzik, A., Pokharel, Y.R., Kaur, A., Li, S.P., Trotman, L., Taimen, P., Rannikko, A., Lammerding, J., Paatero, I., Mirtti, T., Ivaska, J., Westermarck, J.
- Source
- Full text @ Mol. Oncol.
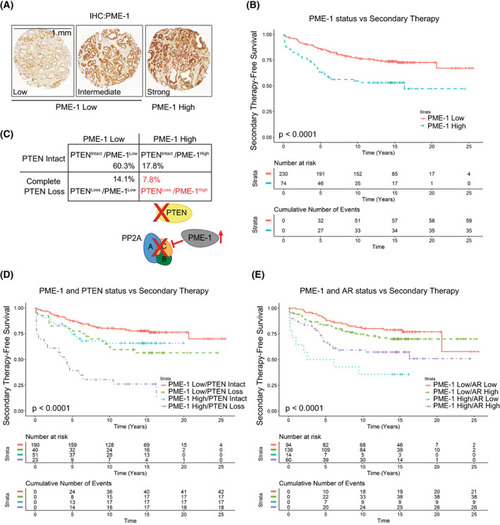
PME‐1 overexpression associates with PTEN loss and therapy relapse of PTEN‐negative prostate cancer patients. (A) PME‐1 protein expression in PCa tissue microarray material from 358 patients treated primarily with radical prostatectomy in the Helsinki University Hospital between 1983 and 1998 was assessed by immunohistochemical stainings. PME‐1 protein content was scored using 4‐tier scale; negative (not shown), low, intermediate and strong expression. In subsequent clinical analysis negative‐intermediate immunopositivity of PME‐1 was considered as PME‐1 Low, whereas strong PME‐1 immunopositivity was considered as PME‐1 High. Scale bar 1 mm. (B) Kaplan‐Meyer analysis of time to secondary therapies after primary treatment based on PME‐1 status alone. P‐value by log rank test. (C) Assessment of the status of PME‐1 and PTEN in the patient populations and the putative effect on PP2A activity. (D, E) Kaplan‐Meyer analysis of time to secondary therapies after primary treatment based on PME‐1 status in combination with PTEN deletion (D) and AR expression (E). P‐values by log rank test. |
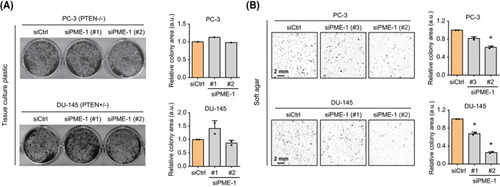
PME‐1 promotes anchorage‐independent growth of prostate cancer cells. (A) The effect of PME‐1 depletion, using two independent siRNAs, was investigated by colony formation assays (10 days of growth) in two PTEN‐deficient PCa cells lines PC‐3 and DU‐145. (Left) Representative images of the wells. (Right) Bar graphs depicting the quantified data, mean ± SD of one (PC‐3) or two (DU‐145) independent experiments. (B) The effect of PME‐1 knock‐down on anchorage‐independent growth in soft agar assays (14 days of growth) in both PC‐3 and DU‐145 cells. (Left) Representative images depicting the colonies. (Right) Bar graphs displaying the quantified data, mean ± SD of two independent experiments. *P < 0.05, Welch's t‐test. |
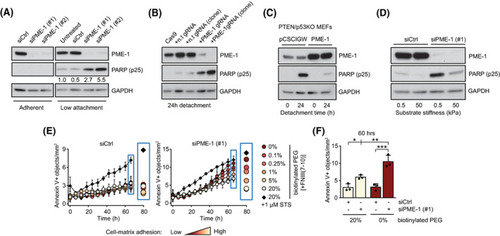
PME‐1 promotes anoikis resistance in PTEN‐deficient prostate cancer cells. (A) siCtrl‐ and siPME‐1‐transfected PC‐3 cells were plated 72 h post‐transfection on normal cell culture or low‐attachment plates for 24 h, before collection and lysis, and subsequently analyzed by western blotting for cleaved PARP‐1 (cPARP (p25)). Shown is a representative result from six independent experiments. (B) Apoptosis induction, as measured by PARP cleavage, in CRISPR/Cas9 generated PC‐3 cells, with and without non‐targeting gRNA (lanes 1–3), a pool of PME‐1 gRNA transfected cells (lane 4), and a single cell subclone of PME‐1 targeted cells (lane 5), after 24 h detachment. Shown is a representative result from three independent experiments. (C) The effect of stable PME‐1 overexpression in mouse embryonic fibroblasts (MEFs) from a PTEN/p53KO mouse model, after 24 h of detachment, was assessed by western blotting for cleaved PARP. Shown is a representative result from two independent experiments. (D) Mechanosensitive PARP cleavage in PME‐1‐depleted PC‐3 cells. The cells were cultured on soft (0.5 kPa) or stiff (50 kPa) polyacrylamide hydrogel for 24 h before being scraped into PBS, spun down, lyzed and analyzed for protein expression. Shown is a representative result from four independent experiments. (E) The number of Annexin V positive objects, a marker for apoptosis, in cultures of siCtrl‐ and siPME‐1‐transfected PC‐3 cells upon varying degrees of cell‐matrix interaction. The cells were grown on PEG (Poly(ethylene glycol))‐coated surfaces with 0–20% biotinylated compound bound to integrin ligand, fibronectin fragment FNIII(7–10). STS = staurosporine. Mean ± SD of three independent experiments. (F) Annexin V positive objects in PC‐3 cultures with no or high levels of integrin ligand, after 60 h of incubation. Mean ± SD of three independent experiments. *P < 0.05, **P < 0.01, ***P < 0.001, one‐way ANOVA with Bonferroni's multiple‐comparison test. |
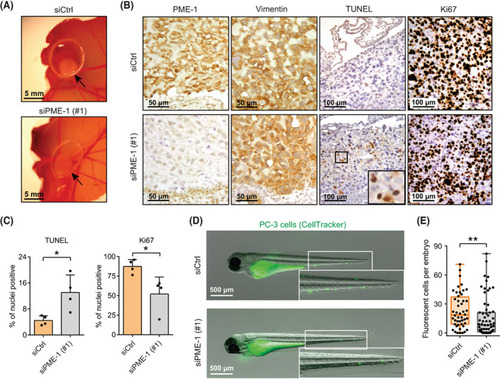
PME‐1 supports in vivo anoikis resistance and survival of prostate cancer cells in circulation. (A) The effect of PME‐1 on anchorage‐independent growth of PC‐3 cells on chick chorioallantoic membrane (CAM). PC‐3 cells were transiently transfected with either control siRNA (siCtrl) or PME‐1‐targeting siRNA (siPME‐1), and 24 h post‐transfection placed on the CAM. Growth of tumours was followed for 3–5 days. Shown are representative examples from three replicate experiments. (B) Immunohistological staining of dissected tumours using antibodies for PME‐1, Vimentin, TUNEL and Ki67. Shown are representative images from three (Ki67) or two (TUNEL) replicate experiments. Scale bar 50 μ |

The potential mechanisms for PME‐1‐mediated anoikis resistance. (A) Immunofluorescence images (left) and quantification (right) depicting phosphorylated FAK (Y397) and early endosomal marker EEA1 in control and PME‐1‐depleted PC‐3 cells grown on soft (0.5 kPa) hydrogels for 24 h. Scale bar, 10 μm (main), 2 μm (inset). Mean ± SD from a representative of two independent experiments. (B) Fluorescence images depicting filamentous actin in control and PME‐1 KO PC‐3 cells treated with DMSO or increasing concentrations of Cytochalasin D (0.1–10 μ |