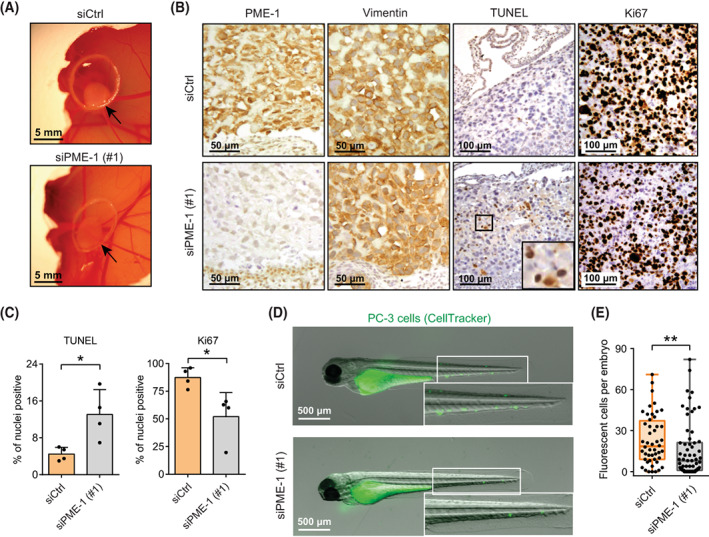
IMAGE

Fig. 4

ID
ZDB-IMAGE-230613-56
Source
Figures for Aakula et al., 2022
Image
Figure Caption

Fig. 4

PME‐1 supports in vivo anoikis resistance and survival of prostate cancer cells in circulation. (A) The effect of PME‐1 on anchorage‐independent growth of PC‐3 cells on chick chorioallantoic membrane (CAM). PC‐3 cells were transiently transfected with either control siRNA (siCtrl) or PME‐1‐targeting siRNA (siPME‐1), and 24 h post‐transfection placed on the CAM. Growth of tumours was followed for 3–5 days. Shown are representative examples from three replicate experiments. (B) Immunohistological staining of dissected tumours using antibodies for PME‐1, Vimentin, TUNEL and Ki67. Shown are representative images from three (Ki67) or two (TUNEL) replicate experiments. Scale bar 50 μm for PME‐1 and Vimentin stainings and 100 μm for TUNEL and Ki67. (C) Quantification of TUNEL‐ and Ki‐67‐positive nuclei in the excised CAM tumours. Mean ± SD from a representative experiment with four eggs per condition, *P < 0.05, Mann–Whitney test. (D) The survival of siCtrl‐ and siPME‐1‐transfected PC‐3 cells in circulation. The cells were microinjected into the common cardinal veins of zebrafish embryos 72 h post‐transfection. After overnight incubation the embryos were imaged by fluorescence stereomicroscopy. Scale bar 500 μm. (E) The number of surviving fluorescent tumour cells per embryo from (D). Box plots depicting the range, 25th, 50th and 75th percentiles of the data overlaid with the individual data points combined from three independent experiments. **P < 0.01, Mann–Whitney test.

Acknowledgments
This image is the copyrighted work of the attributed author or publisher, and ZFIN has permission only to display this image to its users. Additional permissions should be obtained from the applicable author or publisher of the image. Full text @ Mol. Oncol.