
- Title
-
Prematurely terminated intron-retaining mRNAs invade axons in SFPQ null-driven neurodegeneration and are a hallmark of ALS
- Authors
- Taylor, R., Hamid, F., Fielding, T., Gordon, P.M., Maloney, M., Makeyev, E.V., Houart, C.
- Source
- Full text @ Nat. Commun.
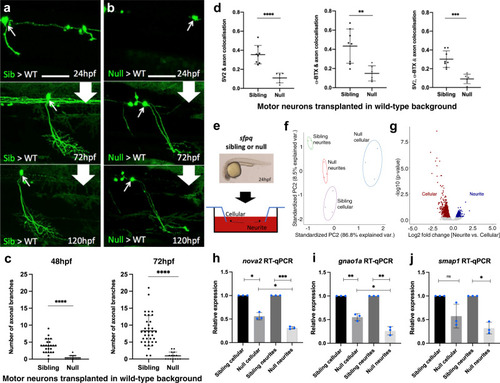
Characterisation of the impact of SFPQ-depletion on neurites.
a, b Confocal z-projections (150 μm), lateral view, anterior to the left, of transplanted sfpq; tg(mnx1:GFP) sibling (a) & null (b) motor neurons in wild-type hosts. Scale bar 25 μm. c Quantification of all branches on transplanted sibling and null GFP + motor neurons at 48 hpf (Left) and 72 hpf (Right). Each datapoint represents an individual neuron. Two-tailed, unpaired t tests with Welch’s correction. Means plotted with SD. (48 hpf) Sibling: 24 neurons, 9 hosts (6 donors), Null: 15 neurons, 4 hosts (4 donors), ****p < 0.0001. (72 hpf) Sibling: 37 neurons, 14 hosts (11 donors), Null: 15 neurons, 4 hosts (4 donors), ****p < 0.0001. d Quantification of axon colocalisation with synaptic markers. The portion of axon overlapping with each marker was calculated. Each point represents an axon of a different neuron. Sibling, n: 8 neurons from 3 hosts (2 donors); null n: 6 neurons from 2 hosts (2 donors). Two-tailed Unpaired ttests performed with Welch’s correction. Mean plotted with SD. (Left) ****p < 0.0001, (Middle) **p:0.0024, (Right) ***p:0.0001. e Sibling versus null cells from dissociated sfpq, tg(mnx1:GFP) embryos were plated onto the upper membrane surface transwell inserts. Neurites can extend through 1 μm pores and adhere to the lower surface. f Principal component analysis plot of the 12 cellular and neurite RNA samples using 1359 highly variant genes. g Plot showing clusters for transcripts enriched in sibling cellular and neurite compartments. Cellular: FC > 1.5, p < 0.05; 1030 genes. Neurite: FC > 1.25, p < 0.05; 329 genes (p-values calculated using two-sided Wald tests). h–j RT-qPCR validation of neurite-specific gene downregulation in null (n = 3 biological replicates, blue dots). Expression normalised to relevant compartment actl6a expression. Sibling expressions were set to 1. Two-tailed unpaired ttests with Welch’s correction. Means plotted with SD. h nova2, cellular, *p:0.0103; neurite, ***p:0.0004; cellular vs neurite, *p: 0.0232. i gnao1a, cellular, **p:0.009; neurite, **p:0.0045; cellular vs neurite, *p:0.0121. j smap1, cellular, p = 0.0989; neurite, *p:0.0111. Source data are provided as a Source Data file. |
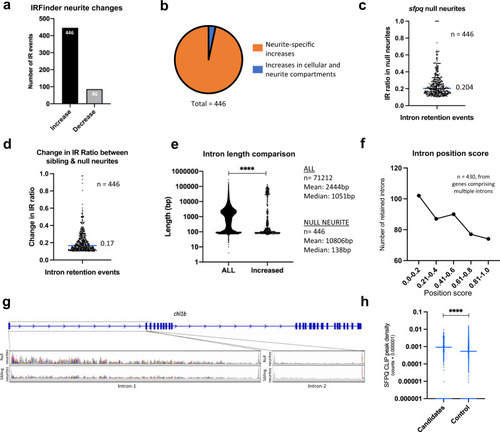
Loss of SFPQ modifies distribution of neurite-specific retained introns.
a Number of intron retention increases and decreases observed in null neurites identified in IR Finder (>0.1 change in IR Ratio, Audic & Claverie test, p < 0.05) (b) Proportion of intron retention increases that are neurite-specific (change in neurite IR Ratio is >0.05 above that in the cellular compartment). 15 intron retention events (blue slice) increase similarly in both the neurite and cellular compartments. c Proportion of transcripts for each of the 446 genes in (a) that are intron-retaining in null neurites. Median IR ratio = 0.204 (i.e. ~20% of all transcripts of a given gene). d Change in IR ratio from sibling neurites to null neurites (median increase = 0.17). e Length of all introns from the annotated genome compared with the length of the 446 introns in (a). Two-sided wilcoxon-signed rank test, ****p < 0.0001. f Positional information of the retained introns in (b). g Cell adhesion like molecule L1-like (b) (chl1b) RNAseq BAM files showing increased intron-1(102 kbp long) retention in null neurites, and no retention of intron-2 (used as control) in either sibling or null neurites. h CLIP peak density scores for 356 mouse homologues of zebrafish introns identified by IRFinder and vast-tools as being more retained in null neurites, and of 7203 control non-retained introns from the same genes. Two-tailed Mann–Whitney test, ****p < 0.0001. |
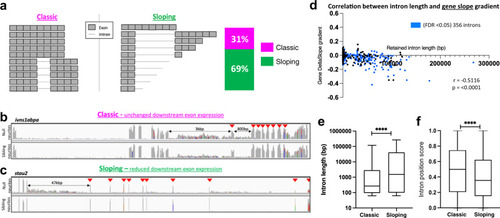
Two types of intron-retaining transcripts become neurite localised in null neurons.
a Schematic representation of the two types of IR-transcripts enriched in null neurites. The stacked bar graph shows the proportion of genes expressing ‘classic’ full-length IR transcripts (magenta) and ‘sloping’ prematurely terminated IR transcripts (green) transcripts; n = 356 genes, FDR < 0.05. b, c Example gene plots for each of the two types of IR-transcript in null neurites. Arrows indicate exons downstream of the retained intron/s. b ivns1abpa, intron-8-retaining, and intron-9-retaining transcripts with no change in downstream exons expression. c stau2, intron-5-retaining transcripts showing reduced expression of downstream exons. d Correlation between retained intron length and 5’→3’ exonic read slope gradient. Gradients calculated for the 356 genes encoding IR-transcripts (blue datapoints, FDR < 0.05). Two-sided Pearson correlation coefficient, r: −5116, p < 0.0001. e Box and whiskers plot showing the difference in length of retained introns in each IR-transcript category. The box boundaries represent the upper and lower quartiles, and the middle line is the median. Whiskers show maximum and minimum values. Two-sided Wilcoxon-signed rank test, ****p < 0.0001. n = 570 introns from multiple intron-containing genes. f Box and whiskers plot showing the difference in position of the retained introns in transcripts for each IR-transcript category. The box boundaries represent the upper and lower quartiles, and the middle line is the median. The whiskers show the maximum and minimum values. Two-sided Wilcoxon-signed rank test, ****p < 0.0001. n = 570 introns from multiple intron-containing genes. |
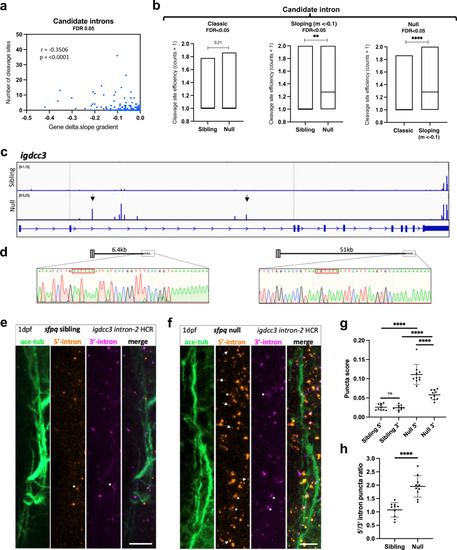
PreT-IR transcripts undergo cleavage/polyadenylation and neurite localisation in SFPQ-deprived neurons.
a Correlation between RNAseq read slope gradient in null and number of cleavage sites in introns of sloping IR-transcripts. Two-tailed Pearson correlation coefficient, r: −0.3506, p < 0.0001 (n = 247 sloping IR-transcripts, FDR < 0.05). b Efficiency of cleavage site usage in classic (Left; (n = 107, FDR < 0.05)) and sloping (Middle; (n = 37, m < −0.1, FDR < 0.05)) IR-transcripts in sibling and null samples. (Right) Efficiency of cleavage site usage in retained introns between classic versus sloping IR-transcripts in null samples. Floating bar plots where the middle represents the median and the upper and lower limits represent the maximum and minimum values. Two-tailed Mann–Whitney tests. (Left) p = 0.21, (Middle) **p:0.0076, (Right) ****p < 0.0001 (c) Positions of 3’mRNAseq read clusters along igdcc3 in 24 hpf sibling null embryo RNA samples, indicating sites of cleavage and polyadenylation. Peak height indicates relative usage of each cleavage site among transcripts of that sample. Dashed lines demarcate intron-2. Black arrows indicate peaks targeted by 3’RACE. d 3’RACE validation of igdcc3 3’mRNAseq results in (c) in null neurites. Sequencing of products shows terminal intronic sequences containing PAS consensus sequences (red boxes) and the start of a PolyA tail. (Left) exons 1–2 + 6.5 kb intron-2 and polyA. (Right) exons 1–2 + 51 kb intron-2 and polyA. e, f Confocal z-projections (10 μm) of 1dpf (1 day post-fertilisation/24hpf) sfpq sibling (e) & null (f) embryo axons, and igdcc3 IR and PreT-IR transcripts. Probe sets target either the 5’-most (red) or 3’-most (magenta) 10 kb of intron-2. Axons running longitudinally just anterior to the otic vesicle. Asterisks: axonal RNAs labelled by both intron-2 probe sets. Arrows: axonal RNAs labelled by 5’ intron-2 probe set only. RNA puncta are also present in neuronal cell bodies surrounding axons. Scale bars 10 μm. g, h Quantification of 5’ and 3’ intron-2 puncta in axons in (e, f). Each datapoint represents a different embryo. N = 10 sibling and 10 null embryos. Two-tailed unpaired t tests with Welch’s correction, ****p < 0.0001. Means plotted with SD. Source data are provided as a Source Data file. PHENOTYPE:
|
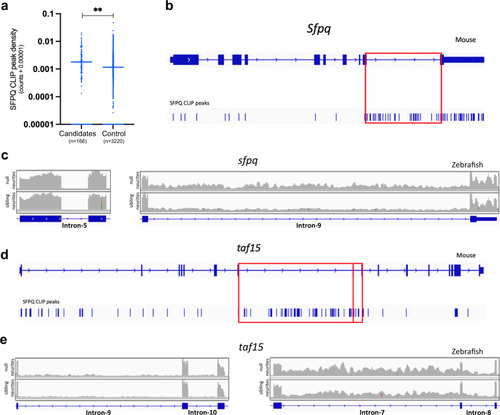
ALS-linked intron retention events are enriched in null neurites.
a CLIP analysis showing the extent of SFPQ binding to mouse homologues of ALS-associated introns. CLIP peak density scores normalise for intron length. Control introns are those not retained in the same genes as ALS-associated introns. Two-tailed Mann–Whitney test, **p < 0.0057. b Intronic CLIP peaks in Sfpq, most mapping to intron-9 (red box). c sfpq RNAseq reads of control intron-5 (Left) and retained intron−9 (Right) in sibling and null neurite samples. d CLIP peaks mapping to taf15. The vast majority of peaks that map to intronic sequences do so in intron-7 and intron-8 (red boxes). e taf15 RNAseq reads of control introns −9 & −10 (Left) and retained introns −7 & −8 (Right) in sibling and null neurite samples. |
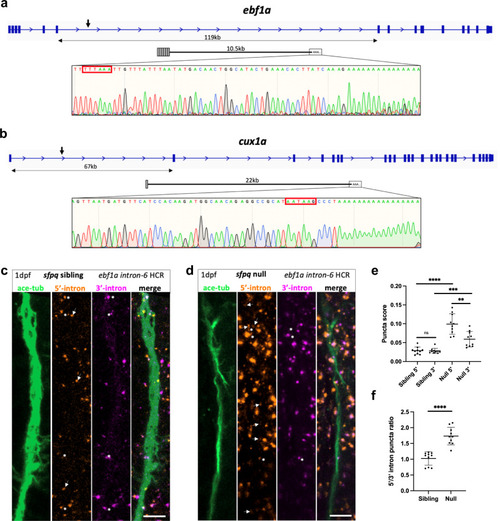
ALS PreT-IR transcripts are enriched in null neurites.
a, b Sequencing traces from 3’RACE products of PreT-IR transcripts for ebf1a (a) and cux1a (b), zebrafish homologues of ALS-affected EBF1 and CUX1, show terminal intronic sequences with polyadenylation signals (red boxes) and start of the polyA tail. a ebf1a PreT-IR transcript comprises exons 1–6 + 10.5 kb intron-6 and polyA tail. b cux1a PreT-IR transcript comprises exon 1 + 22 kb intron-1 and polyA tail. c, d Confocal z-projections (10 μm) of 1dpf/24hpf sfpq sibling (c) & null (d) embryo axons, immunolabelled by targeting acetylated-tubulin, and ebf1a intron-6 IR and PreT-IR transcripts labelled by HCR with probe sets targeting the 5’-most 10 kb of intron-6 (red) and the 3’-most 10 kb of intron-6 (magenta). Axons running longitudinally, situated just anterior to the otic vesicle, were imaged in each embryo. Asterisks show axon localised RNAs labelled by both 5’ and 3’ intron-6 probe sets. Arrows show axon localised RNAs labelled by 5’ intron-6 probe sets only. Note that HCR RNA puncta are also present in neuronal cell bodies surrounding shown axons. Scale bars 10 μm. e, f Quantification of 5’ and 3’ intron-6 puncta in sibling (c) versus null (d) axons. Each datapoint represents a different embryo. N = 10 sibling and 10 null embryos. Two-tailed unpaired t tests with Welch’s correction, **p:0.0016, ***p:0.0008 ****p < 0.0001. Means plotted with SD. Source data are provided as a Source Data file. PHENOTYPE:
|

ZFIN is incorporating published figure images and captions as part of an ongoing project. Figures from some publications have not yet been curated, or are not available for display because of copyright restrictions. |
|
ZFIN is incorporating published figure images and captions as part of an ongoing project. Figures from some publications have not yet been curated, or are not available for display because of copyright restrictions. PHENOTYPE:
|