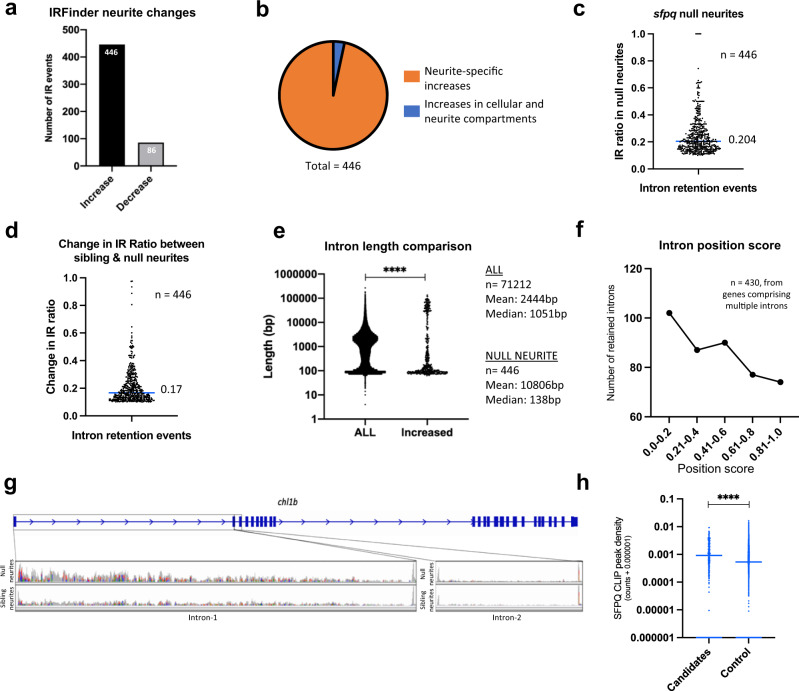
Fig. 2
a Number of intron retention increases and decreases observed in null neurites identified in IR Finder (>0.1 change in IR Ratio, Audic & Claverie test, p < 0.05) (b) Proportion of intron retention increases that are neurite-specific (change in neurite IR Ratio is >0.05 above that in the cellular compartment). 15 intron retention events (blue slice) increase similarly in both the neurite and cellular compartments. c Proportion of transcripts for each of the 446 genes in (a) that are intron-retaining in null neurites. Median IR ratio = 0.204 (i.e. ~20% of all transcripts of a given gene). d Change in IR ratio from sibling neurites to null neurites (median increase = 0.17). e Length of all introns from the annotated genome compared with the length of the 446 introns in (a). Two-sided wilcoxon-signed rank test, ****p < 0.0001. f Positional information of the retained introns in (b). g Cell adhesion like molecule L1-like (b) (chl1b) RNAseq BAM files showing increased intron-1(102 kbp long) retention in null neurites, and no retention of intron-2 (used as control) in either sibling or null neurites. h CLIP peak density scores for 356 mouse homologues of zebrafish introns identified by IRFinder and vast-tools as being more retained in null neurites, and of 7203 control non-retained introns from the same genes. Two-tailed Mann–Whitney test, ****p < 0.0001.

