
- Title
-
Functional identification of the zebrafish Interleukin-1 receptor in an embryonic model of Il-1β-induced systemic inflammation
- Authors
- Sebo, D.J., Fetsko, A.R., Phipps, K.K., Taylor, M.R.
- Source
- Full text @ Front Immunol

ZFIN is incorporating published figure images and captions as part of an ongoing project. Figures from some publications have not yet been curated, or are not available for display because of copyright restrictions. PHENOTYPE:
|
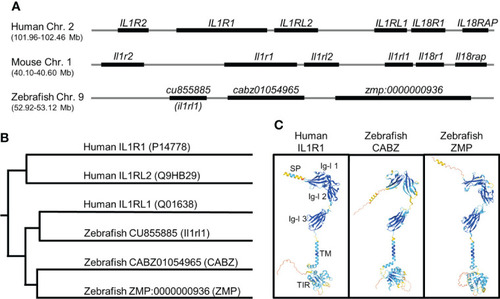
In silico identification of the putative zebrafish interleukin-1 receptor, type 1 (Il1r1). (A) Alignment of human, mouse, and zebrafish genomic regions showing conserved synteny. Shown here are the human and mouse IL-1 receptor clusters and the putative zebrafish IL-1 receptor cluster (not to scale). (B) Phylogenetic alignment of human IL1R protein sequences with putative zebrafish Il1r protein sequences. (C) Predicted protein structures of human IL1R1, zebrafish CABZ (CABZ01054965), and zebrafish ZMP (ZMP:0000000936) showing conserved domains: N-terminal signal peptide (SP), 3 extracellular immunoglobulin-like (Ig-l) domains (Ig-l 1, Ig-l 2, and Ig-l 3), a single transmembrane domain (TM), and an intracellular Toll/Interleukin-1 receptor (TIR). |
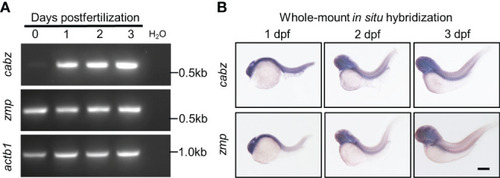
Developmental expression of putative zebrafish Il1r1. (A) RT-PCR from WT embryos at 0-3 dpf showed expression of cabz beginning at 1 dpf, maternal expression of zmp at 0 dpf, and actin beta 1 (actb1) transcript as an experimental control. Molecular weight markers are shown on the right. (B) Whole-mount in situ hybridization using antisense DIG-labeled riboprobes against cabz or zmp transcripts showed unrestricted expression of both transcripts at 1, 2, and 3 dpf. Scale bar in (B) is 200 µm. EXPRESSION / LABELING:
|
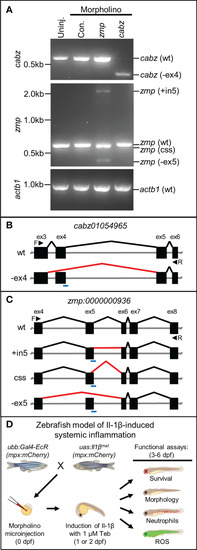
Morpholino knockdown of putative zebrafish Il1r1. (A) RT-PCR of cabz, zmp, and actb1 transcripts from uninjected embryos, control morpholino injected embryos, and cabz and zmp morphants. (B) Schematic of the cabz01054965 (cabz) gene showing exons 3-6, forward (F) and reverse (R) primers used for analysis (black arrowheads), the location of the splice donor site morpholino (blue line), normal splicing of wt (black lines), and aberrant splicing with the cabz morpholino (red line) that excludes exon 4 (-ex4). (C) Schematic of the zmp:0000000936 (zmp) gene showing exons 4-8, forward (F) and reverse (R) primers used for analysis (black arrowheads), the location of the splice donor site morpholino (blue line), normal splicing of wt (black lines), and aberrant splicing with the zmp morpholino (red lines) that includes intron 5 (+in5), introduce a cryptic splice sites (css), or excludes exon 5 (-ex5). (D) Diagram of the experimental paradigm used to functionally identify zebrafish Il1r1. A zebrafish model of Il-1β-induced systemic inflammation was generated by breeding transgenic lines ubb:Gal4-EcR and uas:Ilβmat with or without the neutrophil reporter line mpx:mCherry. Single-celled embryos were injected with morpholino, inflammation was induced with 1 µM Tebufenozide (Teb) at 1 or 2 dpf, and functional analyses were performed from 3-6 dpf to assess morpholino rescue of Il-1β-induced inflammation. |
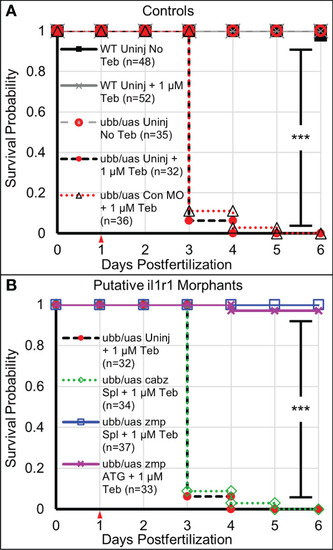
Survival analysis of Il-1β-induced mortality. (A) Kaplan-Meier representations of the survival of WT larvae left untreated (WT Uninj No Teb), or Teb treated (WT Uninj + 1 µM Teb), ubb:Gal4-EcR, uas:Ilβmat larvae with no Teb treatment (ubb/uas Uninj No Teb), with Teb (ubb/uas Uninj + 1 µM Teb), or injected with control morpholino with Teb (ubb/uas Con MO + 1 µM Teb). (B) Kaplan-Meier representations of the survival of ubb:Gal4-EcR, uas:Ilβmat larvae left uninjected with teb treatment (ubb/uas Uninj + 1 µM Teb) injected with the cabz splice donor morpholino with Teb (ubb/uas cabz Spl + 1 µM Teb), zmp splice donor morpholino with Teb (ubb/uas zmp Spl + 1 µ M Teb), or zmp start site morpholino with Teb (ubb/uas zmp ATG + 1 µM Teb). Teb was added to the embryos at 1 dpf (red arrowhead). Note that only the zmp morpholinos rescued Il-1β-induced death. ***p<0.001. PHENOTYPE:
|
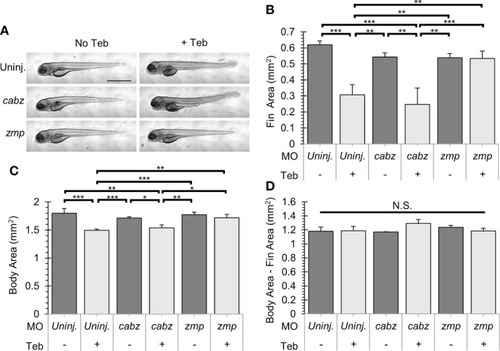
Gross morphological analysis of Il-1β-induced morbidity. (A) Representative images of ubb:Gal4-EcR, uas:Ilβmat larvae showing gross morphology. Shown here are uninjected larvae, cabz morphants, and zmp morphants without Teb (No Teb) and with Teb treatment (+Teb). Note that zmp morphants +Teb showed normal morphology with no gross defects. (B–D) Mean Cross-Sectional Fin Area (B), Body Area (C), and the product of Body Area – Fin Area (D) was plotted in mm2 for each group. Error Bars are +1 standard deviation. Asterisks indicate significant differences *p < 0.05 **p < 0.01 ***p < 0.001; N.S., not significant; by one-way ANOVA followed by Tukey’s HSD Test. Scale bar in (A) is 1 mm. PHENOTYPE:
|
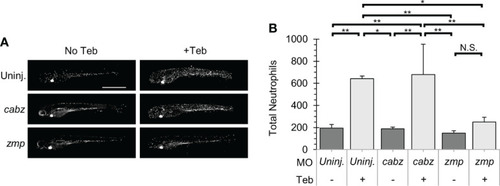
Il-1β-induced neutrophil recruitment. (A) Representative confocal images of ubb:Gal4-EcR, uas:Ilβmat, mpx:mCherry larvae. Shown here are uninjected larvae, cabz morphants, and zmp morphants without Teb (No Teb) and with Teb treatment (+Teb). (B) Neutrophils were counted using FIJI Cell Counter and Total Neutrophil counts were plotted for each group. Error Bars are +1 standard deviation. Asterisks indicate significant differences *p < 0.05 **p < 0.01; N.S., not significant; by one-way ANOVA followed by Tukey’s HSD Test. Scale bar in (A) is 1 mm. |
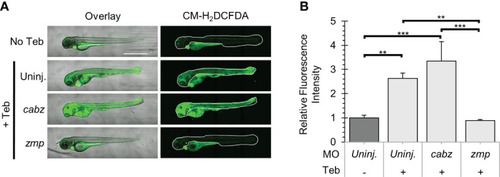
Analysis of Reactive Oxygen Species in Il-1β-induced inflammation. (A) Representative confocal images of ubb:Gal4-EcR, uas:Ilβmat larvae treated with CM-H2DCFDA. Shown here are the overlay of brightfield and CM-H2DCFDA fluorescence (left panels) and CM-H2DCFDA fluorescence only (right panels). Fluorescence signal was quantified from the region of interest outlined with a white border in the CM-H2DCFDA images. (B) Relative Fluorescence Intensity (RFI) was quantified using FIJI ‘mean grey value’ measurement. All mean RFIs were normalized to uninjected No Teb mean values. Error Bars are +1 standard deviation. Asterisks indicate significant differences **p < 0.01 ***p < 0.001 by one-way ANOVA followed by Tukey’s HSD Test. Scale bar in (A) is 1 mm. PHENOTYPE:
|