
- Title
-
High-throughput detection of craniofacial defects in fluorescent zebrafish
- Authors
- Everson, J.L., Tseng, Y.C., Eberhart, J.K.
- Source
- Full text @ Birth Defects Res
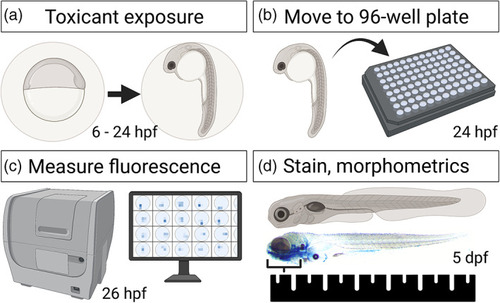
Experimental timeline. (a) Embryos were exposed from 6 to 24 hpf in petri dishes. (b) At 24 hpf, embryos were manually removed from their chorions and loaded into individual wells of a 96‐well plates. (c) At 26 hpf, embryos were scanned and imaged in vivo on a plate reader. (d) Embryos were then developed to 5 dpf, upon which time embryos were euthanized, fixed, stained, imaged, and finally morphologically measured. hpf = hours post fertilization, dpf = days post fertilization |
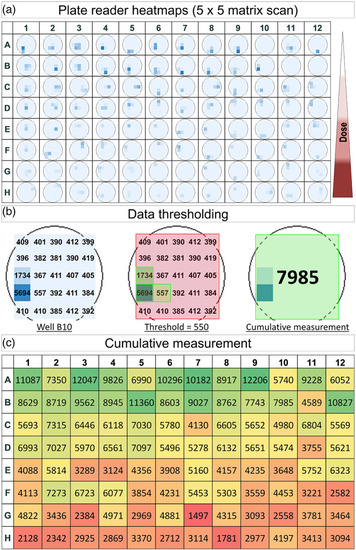
Plate reader data analysis. (a) Heatmaps show the area scan results for a single 96‐well plate. Treatment groups were as follows: (rows A + B = Control, C + D = 1% ETOH, E + F = 1.5% ETOH, G + H = 2% ETOH. (b) For each well, 25 single regions were scanned in a 5 × 5 matrix. These 25 per‐well reads were thresholded to remove background fluorescence and target fluorescence from the head (see methods). (c) Fluorescence that met or exceeded the threshold value were summed to generate a cumulative well measurement for each embryo. ETOH = ethanol |

Ethanol exposure reduces fli1:EGFP expression. (a–d) Fluorescent images of 26 hpf fli1:EGFP embryos exposed to control or the indicated concentration of ethanol from 6–24 hpf showing dose‐dependent reduction of fluorescence. (e) Column graph showing fli1:EGFP fluorescence for each embryo (open circles). Black bars show mean fluorescence in relative fluorescence units (RFU) for each group ± SEM. Sample sizes: control n = 15; 1% ETOH n = 16; 1.25% ETOH n = 14; 1.5% ETOH n = 16. Statistic: two‐tailed ANOVA with Tukey's multiple comparison's correction between all groups. *** = p < .001, **** p < .0001. Scale bar = 0.2 mm. RFU = relative fluorescence units. ETOH = ethanol |

PBO and alcohol interact to synergistically reduce fli1:EGFP expression. (a–d) Fluorescent images of 26 h post fertilization (hpf) fli1:EGFP embryos exposed to control or the indicated concentration of PBO, ethanol, or both from 6–24 hpf showing a synergistic interaction between ethanol and PBO. (e) Column graph showing fli1:EGFP fluorescence measurements for each embryo (open circles). Black bars show mean fluorescence for each group ± SEM. Sample sizes: control n = 17; 1% ETOH n = 17; 25 μM PBO n = 14; ETOH+PBO n = 17. Statistic: two‐tailed ANOVA with Tukey's multiple comparison's correction between all groups. **** p < .0001. Scale bar = 0.2 mm. RFU = relative fluorescence units. ETOH = ethanol. PBO = piperonyl butoxide, environmental Hedgehog pathway inhibitor |

Malformation severity scoring. (a, d, g, j) Dorsal, (b, e, h, k) ventral, or lateral (c, f, i, l) images of five days post fertilization (dpf) embryos stained with alcian blue (cartilage) and alizarin red (bone) showing the craniofacial malformation scale that were used to quantify the number of malformations at each severity shown in (m). (n) Bar graph of frequency of malformations following ethanol exposure. Statistics = Fischer's exact test for each control‐treatment group comparison. Scale bar = 0.2 mm |

Ethanol exposure causes dose‐dependent craniofacial defects. (a, top) Schematic showing lateral view of whole embryo for body length (BL) measurement. Scale bar = 1 mm (a, bottom) Schematic showing dorsal view of 5 dpf embryo showing neurocranium length (NL), Trabecula Length (TL), Inter‐trabuculae width (ITW), and ethmoid plate length (EPL). Scale bar = 0.2 mm. (b–f) Column graphs showing each embryo's morphological measurement for each endpoint. Black bars show mean measurement for each group ± SEM. Statistics: two‐tailed ANOVA with Tukey's multiple comparison's correction between all groups. * = p < .05, ** = p < .01, *** = p < .001, **** p < .0001. (g‐j) Representative (based on TL measurement) dorsal or (k‐n) ventral images of 5 dpf bone and cartilage stained embryos for control or the indicated concentration of ethanol show increasing severity of craniofacial malformations with ethanol dose. ETOH = ethanol |

Expression of fli1:EGFP correlates with craniofacial morphometrics. (a) Schematic showing comparison of fluorescence at 1 dpf to craniofacial morphometrics at 5 dpf in the same animal. (b–f) Scatter plots of pair‐wise comparisons for each embryo, where (x = Morphological Measurement at 5 dpf, y = Fluorescence at 1 dpf). Data points are color coded by treatment group (black = control, light gray = 1% ETOH, dark gray = 1.5% ETOH, black = 2% ETOH.) Linear regression analysis mean (solid line) ± standard error (dotted lines) is shown. R 2‐value (coefficient of determination), r‐value (Pearson's correlation coefficient), and correlation p values are shown. RFU = relative fluorescence units. ETOH = ethanol |

Hedgehog pathway disruption reduces fli1:EGFP expression at doses that cause craniofacial malformations. (a) Stacked bar graph showing severity scoring of embryos exposed the potent Hedgehog pathway inhibitor BMS‐833923. Embryos were exposed from 6–24 hpf and stained at 5 dpf. Number of embryos for each severity are shown (white = apparently normal, light gray = mild, dark gray = moderate, black = severe). (b) Collapsed data showing frequency of malformations for each treatment group. Bar graph of frequency of malformations following ethanol exposure. Statistics = Fischer's exact test for each control‐treatment group comparison. (c) Column graph showing fli1:EGFP fluorescence measurement for each embryo (open circles). Black bars show mean fluorescence for each group ± SEM. Sample sizes: control n = 24; 1.56 μM BMS n = 24; 3.125 μM BMS n = 24; 6.25 μM BMS n = 24; and 12.5 μM BMS n = 24. Statistic: two‐tailed ANOVA with Tukey's multiple comparison's correction between all groups. * = p < .05, *** = p < .001, **** p < .0001. (d) Images of 5 dpf embryos stained with alcian blue (cartilage) and alizarin red (bone) showing BMS‐induced craniofacial defects. RFU = relative fluorescence units. BMS = BMS‐833923, Hedgehog pathway inhibitor standard |

Monitoring Hedgehog pathway activity. (a) Column graph showing GliBS:mCherry fluorescence (a marker of Hedgehog pathway activity) for each embryo (open circles) exposed to the indicated concentration of the potent Hedgehog pathway inhibitor standard BMS‐833923 from 6–24 hpf. Black bars show mean fluorescence for each group ± SEM. Sample sizes: control n = 21; 1.56 μM BMS n = 24; 3.125 μM BMS n = 24; 6.25 μM BMS n = 16; 12.5 μM BMS n = 11. Many samples, n = 6 at 6.25 μM and n = 13 at 12.5 μM BMS were below fluorescence threshold and were omitted. Statistic: two‐tailed ANOVA with Tukey's multiple comparison's correction between all groups. (b) Column graph showing GliBS:mCherry fluorescence for embryos exposed to the environmental teratogen PBO from 6–24 hpf. Black bars show mean fluorescence for each group ± SEM. Sample sizes: control n = 23; PBO 3.125 μM n = 23; PBO 6.25 μM n = 23; PBO 12.5 μM n = 23; PBO 25 μM n = 23; PBO 50 μM n = 16. n = 7 samples exposed to 50 μM PBO were below the fluorescence threshold and were omitted. Statistic: two‐tailed ANOVA with Tukey's multiple comparison's correction between all groups. (c) Column graph showing GliBS:mCherry fluorescence for embryos exposed to ethanol from 6–24 hpf. Black bars show mean fluorescence for each group ± SEM. Sample sizes: Statistic: two‐tailed ANOVA with Tukey's multiple comparison's correction between all groups. * = p < .05, ** = p < .01, *** = p < .001, **** p < .0001. RFU = relative fluorescence units. BMS = BMS‐833923, Hedgehog pathway inhibitor standard. PBO = piperonyl butoxide, environmental Hedgehog pathway inhibitor |

Subteratogenic doses of alcohol reduce neural progenitor (elavl3) expression. (a–f) Fluorescent images of 26 hpf elavl3:EGFP embryos exposed to control or the indicated concentration of ethanol from 6–24 hpf. (g) Column graph showing elavl3:EGFP fluorescent read for each embryo (open circles). Black bars show mean fluorescence for each group ± SEM. Sample sizes: control n = 24; 0.25% ETOH n = 22; 0.5% ETOH n = 20; 0.75% ETOH n = 19; 1.0% ETOH n = 24; and 1.25% ETOH n = 24. Statistic: two‐tailed ANOVA with Tukey's multiple comparison's correction between all groups. * = p < .05, ** = p < .01, *** = p < .001, **** p < .0001. Scale bar = 0.2 mm. RFU = relative fluorescence units. ETOH = ethanol |