
- Title
-
Dominant ARF3 variants disrupt Golgi integrity and cause a neurodevelopmental disorder recapitulated in zebrafish
- Authors
- Fasano, G., Muto, V., Radio, F.C., Venditti, M., Mosaddeghzadeh, N., Coppola, S., Paradisi, G., Zara, E., Bazgir, F., Ziegler, A., Chillemi, G., Bertuccini, L., Tinari, A., Vetro, A., Pantaleoni, F., Pizzi, S., Conti, L.A., Petrini, S., Bruselles, A., Prandi, I.G., Mancini, C., Chandramouli, B., Barth, M., Bris, C., Milani, D., Selicorni, A., Macchiaiolo, M., Gonfiantini, M.V., Bartuli, A., Mariani, R., Curry, C.J., Guerrini, R., Slavotinek, A., Iascone, M., Dallapiccola, B., Ahmadian, M.R., Lauri, A., Tartaglia, M.
- Source
- Full text @ Nat. Commun.
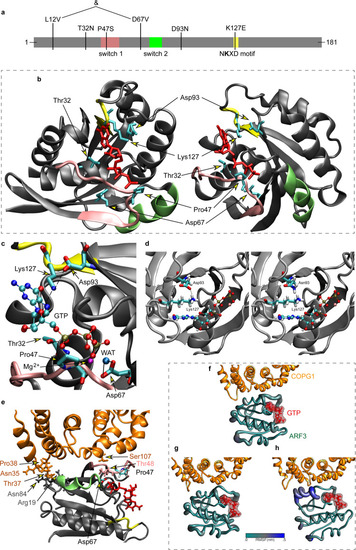
a Domain organization of ARF3 excluding the unstructured C-terminal tail. Switch 1, switch 2 and the NKXD fingerpoint motif are highlighted in pink, green and yellow, respectively. The variants identified in affected subjects are also reported. b 3D structure in two different orientations of GTP-bound ARF3 interacting with the MARTX toxin (PDB 6ii6). Side chains of the ARF3 residues mutated in the affected subjects and GTP are in cyan and red, respectively. Main chain of residues belonging to switch 1, switch 2 and NKXD fingerpoint motif are colored as above. c Enlargement of the ARF3 GTP binding pocket with the five mutated residues. The direct hydrogen bond between the N atom in the Lys127 lateral chain and the oxygen atom of the GTP ribose ring is highlighted in dashed line. The Mg2+ ion is colored in magenta, while the oxygen atom of the water molecule, mediating the interaction between Asp67 and the manganese ion, is shown in light blue color. The two hydrogen bonds between Asp67 and the water molecule are highlighted with dotted lines. d Zoom showing the structural organization around residue 93. Left: view of the WT Asp93 forming a hydrogen bond with Lys127. Right: structure with the p.Asp93Asn mutation and hydrogen bond breaking. The Mg2+ ion is colored in magenta. e Homology model of GTP-bound ARF3 interacting with the cytosolic coat protein complex COPG1-COPZ1 (PDB: 3TJZ) validated by a 500-ns molecular dynamics (MD) simulation. The region of contact between ARF3 and COPG1 (orange color) is shown in (e). f–h MD simulations of wild-type (f), p.Asp67Val (g), and p.Pro47Ser (h) ARF3 complexed with COPG1-COPZ1. Residues involved in the contact are shown with their side chain and colored as the respective protein/region. ARF3 backbone is represented with a diameter proportional to its per-residue fluctuations (RMSF). |
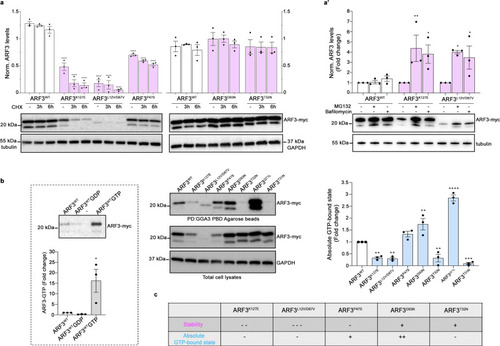
a, a’ Western blot analysis showing the protein levels of myc-tagged ARF3WT and all the identified mutants in transfected COS-1 cells, basally and after treatment with cycloheximide (CHX) (10 μg/ml) for the indicated time points (a), and with MG132 (100 μM), or bafilomycin A1 (200 nM) for six hours (a’). b Pull-down assay using GGA3-conjugated beads shows ARF3 activation in COS-1 cells transiently transfected with WT or mutant myc-tagged ARF3 expression constructs. Active and total ARF3 levels are monitored using anti-myc antibodies. GAPDH and beta-tubulin are used as loading controls. Pull-down assays of ARF3WT transfected cells performed in the presence of an excess of GDP and γGTP are used as negative and positive controls, respectively (b, left panel). Pulldown samples in b (left and right), are loaded on different blots and processed parallelly. Representative blots are shown and data are expressed as mean ± SEM of three independent experiments. Two-way ANOVA followed by Tukey’s post hoc test (a, WT vs. all mutants, ****p < 0.0001; a’, K127E vs. K127E + MG132 **p = 0.0052; K127E vs. K127E + Bafilomycin *p = 0.0195; L12V/D67V vs. L12V/D67V + MG132 *p = 0.0123; L12V/D67V vs. L12V/D67V + Bafilomycin *p = 0.0411), One-way ANOVA followed by Sidak’s post hoc test (b left panel, WT vs. WT + GTP *p = 0.0197), One-way ANOVA followed by Dunnett’s post hoc test (b, WT vs. K127E **p = 0.0088; WT vs. L12V/D67V **p = 0.0058; WT vs. D93N **p = 0.0035; WT vs. T32N **p = 0.0075; WT vs. Q71L ****p < 0.0001; WT vs. T31N ***p = 0.0006) are used to assess statistical significance. c Summary table of the data obtained relative to the stability and activity of the different ARF3 mutants. Source data are provided as a Source Data file. |

a Maximum intensity confocal z-projections showing immunostaining against Golgin-97 (trans-Golgi marker) (green) performed in fixed COS-1 cells transiently transfected with mCherry-tagged ARF3WT, ARF3T31N, and ARF3Q71L (DN and CA variants, respectively) or mutants identified (magenta) for 48 h. Composite colocalization images are shown in the right panels with nuclei (DAPI staining) in blue. The images are representative of three independent experiments. Scale bars = 2 µm (high magnification) and 10 µm (all the other images). b Golgi means intensity and area define distinct Golgi morphotypes. Dot plots of mean intensity (MI) and area of Golgi in cells transiently transfected with mCherry-tagged ARF3WT, or ARF3Q71L and ARF3T31N mutants (up, middle, bottom panels) are shown. Golgi MI and area (% of the whole cell) of cells were measured based on Golgin-97 staining. Whole-cell area was determined using the area covered by mCherry fluorescence as a mask. Representative 3D rendering images of the observed Golgi staining are shown. Cell populations located in different gates are characterized by distinct Golgi morphologies: Compact: A < 2.6 and MI > 1.5 (green gate); expanded Golgi: 2.7 < A < 12 and MI > 0.8, (purple gate); partially dispersed Golgi: 2.7 < A < 12 and MI < 0.8 (pink gate); totally dispersed Golgi: A > 12 and MI < 0.8 (bordeaux gate). c Incidence of trans-Golgi morphotypes. The bar graph represents the percentage of cells showing compact, expanded, partially or fully dispersed distribution (part.disp and ful.disp.) of Golgi in mCherry-tagged ARF3 transfected cells, based on the classification described above in (b). No. of cells = 26 (WT); 22 (Q71L); 29 (T31N); 20 (K127E); 20 (L12V/D67V); 21 (P47S); 28 (D93N) and 27 (T32N). Data are expressed as mean ± SEM of three independent experiments. Two-sided Chi-square’s test in a 2 × 2 contingency table (WT vs. all mutants, compact vs. all phenotypes ****p < 0.0001) is used to assess statistical significance. Arb.units = arbitrary units. Source data are provided as a Source Data file. |

a Schematic representation of the experimental setup in both in vitro and in vivo systems. COS-1 cells are transfected with DNA constructs expressing WT and mutant ARF3-mCherry (magenta) and EGFP-GalT (trans-Golgi marker, green) and analyzed by live confocal microscopy between 4 and 6 h post-transfection. Zebrafish embryos are injected at 1 cell stage with WT and mutant ARF3-mCherry and EGFP-GalT mRNA. mKOFP-CAAX mRNA is used as a membrane marker (cyan). Animals are analyzed by live confocal microscopy during gastrulation (~6–7 hpf). b, c Maximum intensity projections of confocal images of a single time-lapse experiment (Supplementary Movie 1) performed in transfected COS-1 cells at 15 min (~4 h post-transfection) and 120 min later (~6 h post-transfection) from the start of the time-lapse experiment. The images show diffused EGFP-GalT signal (trans-Golgi fragmentation) in ARF3K127E over time (white arrows). Scale bar = 20 μm. d, e 3D image reconstructions from live confocal acquisitions of the animal pole in developing zebrafish embryos expressing ARF3WT and ARF3K127E at the mid-gastrulation stage (~6 hpf). White arrowheads indicate a compact trans-Golgi morphology surrounding the nucleus (“ribbon”) in the EVL cells. Yellow arrowheads indicate cells showing “punta” morphology of the trans-Golgi dispersed throughout the cytosol. Scale bars = 20 and 50 μm. The images are representative of embryos from two independent batches. Quantification is shown in Supplementary Fig. 10a. Source data are provided as a Source Data file. |

a Maximum intensity confocal z-projections of COS-1 cells expressing mCherry-tagged ARF3WT and all identified mutants and stained for the β-subunit of COP-I. The right panel shows a magnification of β-COP signal. Nuclei are labeled with DAPI (blue). Yellow and red and purple arrowheads: normal, diffused, and expanded β-COP signal, respectively. Scale bar is 10 μm. The images are representative of cells from a single experiment. b Quantification of the percentage of WT and ARF3 mutant cells showing different classes of phenotypes as indicated in the legend (compact and expanded: clustered signal visible at the PN region and with a ratio between COP-I area/nucleus area ≤0.25 or >0.25, respectively). No. of cells = 18 (WT); 26 (K127E, compact vs. diffused ****p < 0.0001, compact vs. expanded ****p < 0.0001); 16 (L12V/D67V, compact vs. diffused ****p < 0.0001); 18 (T32N); 15 (D93N, compact vs. expanded ***p = 0.0007) and 15 (P47S, compact vs. expanded **p = 0.011). Two-sided Chi-square test in 2 × 2 contingency table is used to assess statistical significance. Source data are provided as a Source Data file. |

a Maximum intensity confocal z-projections showing the distribution of Tfn-488 (black dots) upon 30 min of incubation in COS-1 cells expressing mCherry-tagged ARF3WT and all identified mutants. Red circle indicates Tfn signal at the perinuclear region (PN). Outlines (black in a and yellow in c) depict the boundaries of representative transfected cells. The black and white images are rendered by inverting the original LUT in Fiji and nuclei are pseudo-colored (purple) in the images. The images are representative of two independent experiments. b–b’ Incidence of cells showing “clustered”, “semi-clustered” or “dispersed” Tfn staining (b) and the ratio of the cells (%) showing “clustered” Tfn phenotype normalized by not-transfected cells (NT) with the same phenotype (b’, internal control). No. of cells = 42 (WT); 22 (K127E, ****p < 0.0001); 33 (L12V/D67V, ***p = 0.0002); 31 (P47S); 26 (D93N); and 25 (T32N). Data are expressed as mean ± SEM (b, b’) of three (WT) and two (all the other mutants) independent experiments. c Maximum intensity confocal z-projections showing COS-1 cells expressing ARF3WT and all identified mutants, incubated with Tfn-488 for 30 min followed by immunostaining against Rab5 (marker of early endosomes). For all the panels single channels (ARF3mCherry: gray, Tfn-488: magenta, Rab5: green), the merge showing the co-localization between Tfn and Rab5 are shown. The insets in the white square show a zoom on the PN co-localization signal. Nuclei are stained with DAPI. The images are representative of cells from a single experiment. d Colocalization analysis showing the spatial co-occurrence of Tfn and Rab5+ signals at the PN region in the z-stacks analyzed, no. of cells = 13 (WT; K127E ****p < 0.0001; T32N), 16 (L12V/D67V, **p = 0.0016; D93N), 21 (P47S). The fraction (%) of Tfn+ signal co-localized with Rab5+ vesicles at the PN (thresholded Mander’s coefficient M1) is reported as box-and-whisker with median (middle line), 25th–75th percentiles (box), and min–max values (whiskers) of a single experiment. All the data points and the mean (“+”) are also shown. Two-sided Chi-square’s test in a 2 × 2 contingency table (semi-clustered and dispersed vs. clustered, b), One-way ANOVA followed by Dunnett’s multiple comparison post hoc test (b‘, d) are used to assess the statistical significance. Source data are provided as a Source Data file. |

a Experimental strategy in zebrafish models. Injected with WT and mutant ARF3-encoding mRNAs at 1 cell stage and phenotyped at different stages. b–b’ Images and close-ups of ARF3WT and ARF3K127E expressing embryos at 24 hpf, co-injected with GFP-CAAX-encoding mRNA and Phenol-Red (dashed circle depicts cephalic region). c Bright-field images of embryos expressing WT and mutant ARF3. The images are representative of embryos from two (b, b’) and five (c) independent batches. c’ Embryo survival, no. of embryos = 246, 114, 53, 86, 85, 161, 114 (not injected, WT, K127E, *p = 0.03, L12V/D67V, P47S, D93N, T32N) from pooled batches. c” Incidence of gross phenotypes at 24 hpf (classes: I, II = yellow arrows, III, IV = gray and black arrows, respectively), no. of embryos = 132 (not injected); 69 (WT); 21 (K127E, ****p < 0.0001); 58 (L12V/D67V, *p = 0.02); 45 (P47S, *p = 0.03); 86 (D93N, **p = 0.0018); 64 (T32N, ****p < 0.0001). Data are expressed as mean ± SEM of four (not injected, WT), three (D93N), and two (K127E, L12V/D67V, P47S, T32N) independent batches. d–d” Bright-field images (d) and phenotype incidence at 24 and 48 hpf of arf3a/arf3b MO-injected embryos (d’, d”). Respectively, in d’ and d” no. of embryos = 50, 48 (not injected); 25, 22 (MO 0.4 mM, ***p = 0.0002, ****p < 0.0001); 31, 27 (MO 0.6 mM **** < 0.0001); 21, 17 (MO 0.8 mM, ****p < 0.0001) of one batch. e–e” Bright-field images (e) and phenotype incidence at 24 and 48 hpf (e’, e”) of arf3a/arf3b MO-injected embryos (0.6 mM)−/+ARF3WT-encoding mRNA. The images in d and e are representative of embryos of one batch. Respectively in e’ and e”, no. of embryos = 47 (not injected); 22, 18 (MO 0.6 mM, ****p < 0.0001); 17,15 (MO 0.6 mM + ARF3, **p = 0.0091 in e”) of one batch. f Phenotype worsening index at 48 hpf (fold-change) for ARF3 mutants (severe + deceased) compared to controls (co-injected with arf3 MO). In the scatter plot the values < =0 (green) are found in the “alleviation window” depicted with green shading. Dots represent the “worsening index” for each experiment, calculated by dividing the percentage of severely diseased fish (class IV–V) in “MO+” condition by the same percentage obtained in “MO−”condition of two (K127E, L12V/D67V, P47S, T32N) or three (D93N) independent batches. The mean effect of MO for each mutation is also shown as bar graph. No. of embryos = 21 and 36 (K127E – and + MO *p = 0.0307); 58 and 47 (L12V/D67V – and + MO, **p = 0.0068); 45 and 54 (P47S – and +MO); 86 (D93N+ and − MO, ***p = 0.0004); 64 and 35 (T32N – and + MO, *p = 0.0370). Data in the bar graphs are expressed as a mean ± SEM of two independent batches. Survival is assessed by Log-Rank (Mantel–Cox) test (c’), Two-sided Chi-square’s test in a 2 × 2 contingency table (class II, III and IV vs. I in c”, d’, d”, e’, e”) or Two-sided One sample t-test (class III/ IV/V vs. I in f) testing null hypothesis H0, represented by the expected mean value of the control population, are used to assess statistical significance. Source data are provided as a Source Data file. |

a Bright-field images of the head (purple dashed line) in fish expressing WT and mutant ARF3 at 48 hpf (the inset for ARF3K127E documents a severe case). The images are representative of embryos from two independent batches. b–b’ Head area quantification at 48 hpf (b) and 4.5 dpf (b’). In b, set 1: no. of embryos = 25 (not injected), 23 (WT); 22 (K127E, ***p = 0.0002) and 25 (L12V/D67V, *p = 0.0106) of one batch; set 2: no. of embryos = 29 (WT); 28 (P47S); 30 (D93N); 29 (T32N). in b’, no. of embryos = 30 (not injected); 30 (WT); 27 (P47S); 30 (D93N, ***p = 0.0006) and 28 (T32N) of one batch. Data are expressed as box-and-whisker with median (middle line), 25th–75th percentiles (box), and min–max values (whiskers). All the data points and the mean (“+”) are also shown. b” Schematics of the brain volume reduction in human patients harboring a subset of ARF3 mutants and in zebrafish models generated in this study. The human brain in the illustration was created with BioRender.com and modified using Illustrator (Adobe). A summary of OFC and brain malformations data from patients in this study are depicted below (no sign of brain malformation (−), mild (+), moderate (++), and severe (+++) malformations). (c) Volumetric reconstructions (c) and anterior brain volume (white dashed line) from live confocal acquisitions from whole brains of 48hpf Tg(NBT:dsRed) fish injected with mRNA encoding WT and ARF3 mutants. The images are representative of embryos from two independent batches for WT, K127E, and L12V/D67V and from one batch for the other mutants. OT: optic tectum, Ce: cerebellum, Fb: forebrain, Mb: midbrain, Hb: hindbrain. c’ Quantification of the brain volume. Set 1: no. of embryos = 4 (WT); 4 (K127E, *p = 0.0163) from one batch; set 2: no. of embryos = 3 (WT); 3 (L12V/D67V, **p = 0.0029); 4 (P47S, *p = 0.0350 and D93N, ***p = 0.0010) of one batch. Data are expressed as mean ± SEM. Different datasets for the same measurement are shown in adjacent plots with the internal WT control for each set, not injected controls between batches are not significantly different. One-way ANOVA followed by Dunnett’s multiple comparison post hoc test (b, left panel; c’, right panel), Krustal–Wallis followed by Dunn’s multiple comparison post hoc test (b, right panel; b’), unpaired t-test with Welch’s correction (c’, left panel) are used to assess statistical significance. Source data are provided as a Source data file. |

a Schematics of the forebrain (Fb, gray) proliferative zone (pz, cyan) and a confocal scan of the ventral Fb in zebrafish expressing ARF3WT (dashed white circle) showing proliferative and mitotic cells (PCNA and pH3 staining in red and cyan, respectively). Mb:midbrain, Hb:hindbrain. b Maximum intensity z-projections from a subset of confocal sections showing pH3+ mitotic cells within the ventral Fb (vFb) in zebrafish expressing WT and mutant ARF3. The images are representative of embryos from one batch. Dashed white line indicates the Fb ventricle, insets show zooms on pH3+ cells. Arrowheads indicate examples of pH3+ cells in different stages of mitosis: early mitosis (purple); metaphase (green) and late mitosis (blue). c Quantification of the total number of pH3+ cells in pz, no. of embryos = 5 (WT and K127E, *p = 0.0217) of one batch. Data are expressed as box-and-whisker with median (middle line), 25th–75th percentiles (box), and min-max values (whiskers). All the data points and the mean (“+”) are also shown. d, e Incidence of pH3+ cells in the different mitosis stages. No. of cells = 111 and 110 (WT); 61 (K127E, early mitosis vs. metaphase *p = 0.0168, early vs. late mitosis ***p = 0.0003); 88 (L12V/D67V, early mitosis vs. metaphase *p = 0.0115, early vs. late mitosis ****p < 0.0001); 75 (D93N, early mitosis vs. metaphase **p = 0.0028); 110 (P47S); 109 cells (T32N, early mitosis vs. metaphase *p = 0.0267, early vs. late mitosis **p = 0.0069) from five embryos of one batch. Data are expressed as mean ± SEM. In c and e different datasets for the same measurement are shown in adjacent plots with the internal WT control for each set. f Maximum intensity z-projections of the ventral brain stained with the acridine orange (AO). The black and white images are rendered by inverting the original LUT in Fiji. The images are representative of embryos from two independent batches. Orange arrowheads indicate specific staining. vFb pz, ventricle, eyes, and olfactory epithelium (OE) are outlined for morphological guidance, *indicates eyes with pigmentation background. g Quantification of the number of AO + spots. No. of embryos = 6 (WT); 5 (K127E, *p = 0.0163, *p = 0.0461 for upper and lower graphs, respectively); 6 (L12V/D67V, *p = 0.0109); 6 (P47S, **p = 0.0017 and D93N, *p = 0.0387) of one batch. Data are expressed as box-and-whisker with median (middle line), 25th–75th percentiles (box), and min–max values (whiskers). All the data points and the mean (“+”) are also shown. Two-sided Chi-square’s test in a 2 × 2 contingency table (e), One-way ANOVA followed by Dunnett’s (c and g, upper graph) or Kruskal–Wallis followed by Dunn’s (g, lower graph) post hoc tests are used to assess statistical significance. Source dData are provided as a source data file. |
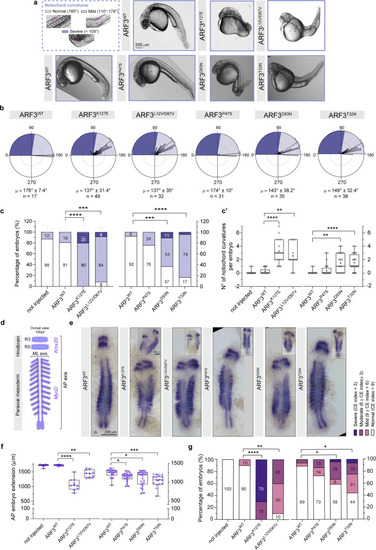
a Notochord curvatures of variable severity (purple angles schematics) and bright filed images of WT and mutant ARF3 expressing fish at 30 hpf. The images are representative of embryos from three (WT, K127E, and L12V/D67V), two (P47S), and one batch (other mutations). b Rose diagrams showing notochord angles, no. of angles = 17 (WT); 49 (K127E); 32 (L12V/D67V); 31 (P47S); 35 (D93N) and 38 (T32N) pooled from a total n of embryos indicated below (c). Mean vector (µ) ± circular SD is shown. Dark and light violet shadings in the rose diagrams represent mild and severe classes of notochord curvatures, respectively. c Incidence of embryos with mild or severe notochord curvatures, set 1: no. of embryos = 9 (not injected); 17 (WT); 15 (K127E, ****p < 0.0001) and 11 (L12V/D67V, ***p = 0.0005) of three independent batches; set 2: no. of embryos = 13 (WT); 28 (P47S); 19 (D93N, ***p = 0.0003) and 24 (T32N, ****p < 0.0001) of one batch. Data are expressed as mean ± SEM (set 1) or mean (set 2). c’ Quantification of the number of notochord curvatures per embryo from one batch (same n of embryos as in c): K127E, ****p < 0.0001; L12V/D67V, **p = 0.0015; D93N, **p = 0.0022 and T32N, ****p < 0.0001. d Schematics of Krox20 and MyoD expression at 15 hpf. Black square brackets indicate AP and ML axes. R3 and R5: rhombomeres 3 and 5. e Bright-field images showing Krox20 and MyoD in situ mRNA staining (insets show severe cases). The images are representative of embryos from two independent batches for WT, K127E and L12V/D67V and from one batch for the other mutations. f Quantification of AP embryo extension, set 1: no. of embryos = 10 (not injected); 10 (WT); 10 (K127E, ****p < 0.0001); 10 (L12V/D67V, **p = 0.0078); set 2: no. of embryos 18 (WT); 22 (P47S, *p = 0.0169); 24 (D93N, *p = 0.0207) and 16 (T32N, ***p = 0.0002) of one batch. In c’ and f data are expressed as box-and-whisker with median (middle line), 25th–75th percentiles (box), and min-max values (whiskers). All the data points and the mean (“+”) are also shown. g Incidence of fish with different convergence and extension (CE) index values (same no. of embryos as in f) ****p < 0.0001 (K127E and L12V;D67V), **p = 0.0015; *p = 0.0251 (D93N), *p = 0.039 (T32N). Different datasets for the same measurement are shown in adjacent plots with the internal WT control for each set. Not injected controls between batches are not significantly different. Non-parametric Kruskal–Wallis followed by Dunn’s multiple comparison post hoc test (c’, f), Two-sided Chi-square’s test in 2 × 2 contingency table (c, g, normal vs. phenotype) are used to assess statistical significance. Source data are provided as a Source Data file. |