
|
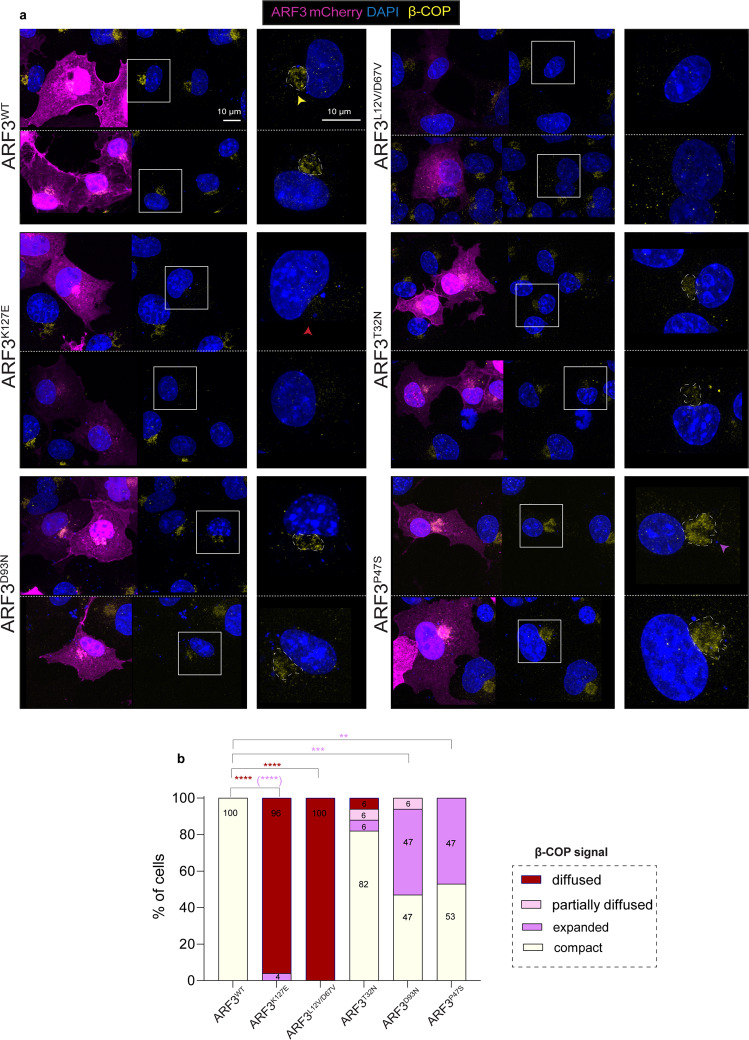
Fig. 5 a Maximum intensity confocal z-projections of COS-1 cells expressing mCherry-tagged ARF3WT and all identified mutants and stained for the β-subunit of COP-I. The right panel shows a magnification of β-COP signal. Nuclei are labeled with DAPI (blue). Yellow and red and purple arrowheads: normal, diffused, and expanded β-COP signal, respectively. Scale bar is 10 μm. The images are representative of cells from a single experiment. b Quantification of the percentage of WT and ARF3 mutant cells showing different classes of phenotypes as indicated in the legend (compact and expanded: clustered signal visible at the PN region and with a ratio between COP-I area/nucleus area ≤0.25 or >0.25, respectively). No. of cells = 18 (WT); 26 (K127E, compact vs. diffused ****p < 0.0001, compact vs. expanded ****p < 0.0001); 16 (L12V/D67V, compact vs. diffused ****p < 0.0001); 18 (T32N); 15 (D93N, compact vs. expanded ***p = 0.0007) and 15 (P47S, compact vs. expanded **p = 0.011). Two-sided Chi-square test in 2 × 2 contingency table is used to assess statistical significance. Source data are provided as a Source Data file.