FIGURE SUMMARY
Title

Novel Loss-of-Function Variant in HNF1a Induces β-Cell Dysfunction through Endoplasmic Reticulum Stress

Authors
Chen, Y., Jia, J., Zhao, Q., Zhang, Y., Huang, B., Wang, L., Tian, J., Huang, C., Li, M., Li, X.
Source
Full text @ Int. J. Mol. Sci.

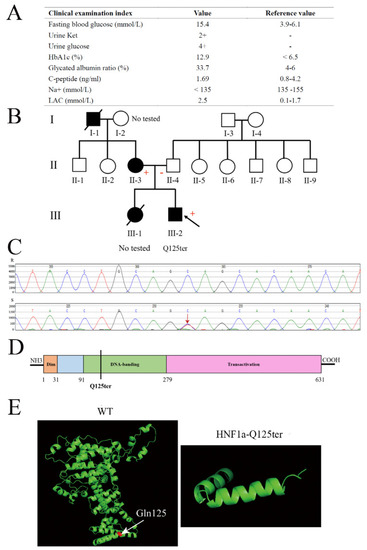
Clinical and functional characteristics of the HNF1a-Q125ter variant. (A) Clinical and biochemical indices of subject carrying the HNF1a-Q125ter variant. Urine glucose and urine ketosis levels suggested the patient had diabetic ketosis. Meanwhile, a high level of LAC indicated lactic acid metabolism disorder: +, positive; −, negative. (B) Pedigree. Circle, female; square, male; black slash segment, death; black arrow, proband. Those affected with diabetes are shaded black. Corresponding variant status, if known. Carriers of the mutation are marked with a (+). (C) Sanger sequencing map of HNF1a-Q125ter variant. Black arrow indicates heterozygous mutation for HNF1a: Exon2, c.373C>T, p.(Gln125*). (D) A diagram showing the HNF1a protein and domains. (E) Protein structure modeling of WT and HNF1a-Q125ter. White arrow indicates Gln125. HbA1c, hemoglobin A1c; LAC, lactic acid; Ket, ketosis.

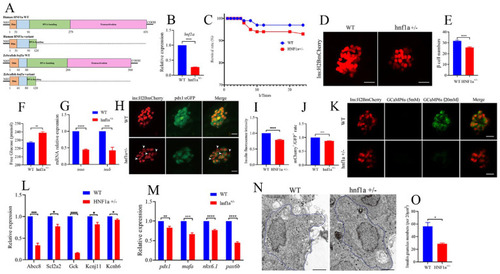
Similar variant impaired β-cell function in zebrafish. (A) Schematic representation of a similar HNF1a-Q125ter variant in zebrafish generated by CRISPR/Cas9. Mutation was caused via a two-base-pair deletion at the CRISPR target site for HNF1a. (B) The transcription level of hnf1a in WT and hnf1a+/−; n = 50 larvae for each genotype. (C) Survival curves of WT and hnf1a+/− zebrafish from 0 h to 24 h. (D,E) Representative confocal images (D) and quantification (E) of the β-cell number from Tg(−1.2ins:H2BmCherry) and hnf1a+/−; Tg(−1.2ins:H2BmCherry) zebrafish larvae. Scale bar indicates 25 μm; n = 20–35 larvae for each genotype. (F) Total free glucose level of WT and hnf1a+/− larvae at 6 dpf. (G) qRT-PCR analysis of the expression of insa and insb mRNA levels in WT and hnf1a+/− larvae at 6 dpf. (H) Representative confocal images of Tg(ins:H2BmCherry); Tg(pdx1:GFP) at 6 dpf for WT and hnf1a+/−. β-cells expressed insulin (mCherry+) without pdx1 (GFP) are shown by white arrows. Scale bar: 10 μm. (I) Quantification of fluorescence intensity for insulin in WT and hnf1a+/−. (J) Quantification of double-positive cells’ (mCherry+/GFP+) rate in WT and hnf1a+/− larvae at 6 dpf; n = 3 larvae for each genotype. (K) Representative images of GCaMP6s response in β cells of Tg(Ins:H2BmCherry); Tg(Ins:GCaMP6s) and hnf1a−/−; Tg(Ins:H2BmCherry); Tg(Ins:GCaMP6s) by 5 or 20 mM glucose ECS solution; the green signal is GCaMP6s. Scale bar: 10 μm. (L) RT-qPCR quantification of mRNA levels for insulin-secretion markers in WT and hnf1a+/− larvae at 6 dpf: abcc8, scl2a2, gck, kcnj11, and kcnh6. (M) RT-qPCR quantification of mRNA levels for β-cell maturation and differentiation markers in WT and hnf1a+/− larvae at 6 dpf: mafa, pdx1, nkx6.1, and pax6b. (N,O) Representative electron micrographs of β cells (N) and quantification of insulin granules (O) in β cells from WT and hnf1a+/− larvae at 6 dpf. (N,O) Transmission electron microscopy for insulin granules. Islet isolation from WT and hnf1a+/− larvae at 6 dpf. The dotted blue lines represent intact individual β cells. Bar scale: 2 μm. n = 3 intact individual β cells for each genotype. Results are represented as means with standard errors; * p < 0.05, ** p < 0.01, *** p < 0.001, and **** p < 0.0001. Student’s t-test. All experiments were performed at least three times, unless otherwise indicated. WT, wild type.

The β cells of hnf1a+/− zebrafish displayed ER stress. (A) Transmission electron microscopy analysis of ER in WT and hnf1a+/− β cells at 6 dpf zebrafish. Blue arrows indicated magnified ER morphology. Scale bar: 3 μm. (B) Quantification of ER lumen width for WT and hnf1a+/− β cells. At least 15 different locations of the same cell were measured; n = 3 β cells for each genotype. (C) RT-qPCR analysis of the mRNA expression levels for ER-stress-related marker genes in WT and hnf1a+/− larvae at 6 dpf: bip, atf4, chop, xbp1, sXBP1, and atf6b. (D) Immunofluorescence analysis of WT and hnf1a+/− larvae at 6 dpf with atf4 staining (Green). β cells are indicated by the red fluorescence with Tg(ins:H2BmCherry). Scale bar indicates 20 μm. (E). Quantification of fluorescence intensity for atf4 in WT and hnf1a+/−; n = 3 larvae for each genotype. (F) RT-qPCR analysis of the mRNA expression levels for nrf2a, nrf2b, gstp1, and hmoxla in WT and hnf1a+/− larvae; n = 3 larvae for each genotype. Results are represented as means with standard errors; * p < 0.05, ** p < 0.01, and *** p < 0.001, and **** p < 0.0001. Student’s t-test. All experiments were performed in at least three biological repeats. WT, wild type.

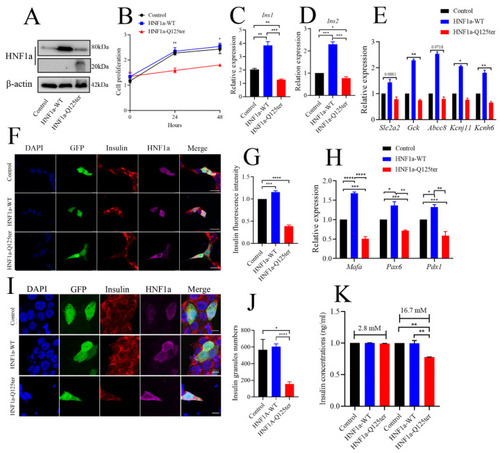
HNF1a-Q125ter impaired β-cell function in vitro. (A) Western blot analysis of HNF1a in INS-1 cells after transfection with control, HNF1a-OE, or HNF1a-Q125ter plasmids for 24 h. (B) The cell-proliferation analysis of control, HNF1a-WT, or HNF1a-Q125ter plasmid transfected Ins-1 cells at 0, 24, and 48 h. (C,D) RT-qPCR analysis of the expression levels of insulin genes Ins1 (C) and Ins2 (D) in Ins-1 cells after plasmid transfection for 24 h. (E) RT-qPCR quantification of insulin-secretion markers in control, HNF1a-WT, and HNF1a-Q125ter after plasmid transfection for 24 h: Slc2a2, GCK, Abcc8, Kcnj11, and Kcnh6. (F,G) Representative immunofluorescence images (F) and quantification of insulin fluorescence (G) of insulin content from control, HNF1a-WT, and HNF1a-Q125ter transfected Ins-1 cell. Insulin was stained with red, and HNF1a was stained with Magenta; GFP indicates the plasmid-transfected positive cells and DAPI-stained nuclei. Scale bar indicates 20 μm. (H) RT-qPCR quantification of β-cell maturation and differentiation markers (Mafa, Pdx1, and Pax6) in control, HNF1a-WT, and HNF1a-Q125ter after transfection for plasmids at 24 h. (I,J) Immunofluorescence analysis of insulin granules in different plasmid-transfected Ins-1 cells. The representative images (I) and quantification (J) of insulin granules are displayed. Insulin stained with red, HNF1a stained with magenta, GFP indicates the plasmid-transfected positive cells, and DAPI is stained nuclei. Scale bar indicates 40 μm. (K) Glucose-stimulated insulin secretion analysis in Ins-1 cells transfected with different plasmids. Results are represented as means with standard errors: * p < 0.05, ** p < 0.01, *** p < 0.001, and **** p < 0.0001. One-way ANOVA. All experiments were performed at least three times, unless otherwise indicated. WT, wild type.

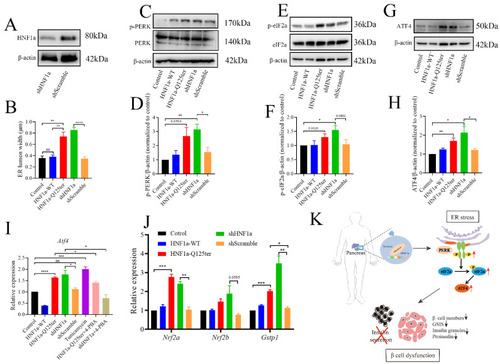
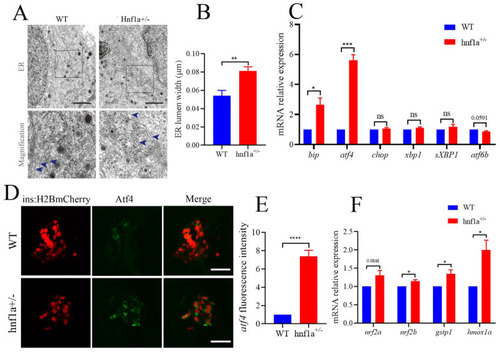
HNF1a-Q125ter induced ER stress through PERK/eIF2a/ATF4 signaling pathway. (A) Western blot of HNF1a in Ins-1 cells transfected with shHNF1a or control construct for 24 h. (B) Quantification of ER lumen width for control, HNF1a-WT, HNF1a-Q125ter, shScramble, and shHNF1a transfected Ins-1 cells, at least 15 different locations of the same cell were measured, n = 5 individual cells for each group. (C,D) Representative Western blot images (C) and quantification analysis (D) of p-PERK and PERK in different plasmids transfected Ins-1 cell. (E,F) Representative Western blot images (E) and quantification analysis (F) of p-eIF2a and eIF2a in different plasmids transfected Ins-1 cell. (G,H) Representative Western blot images (G) and quantification analysis (H) of ATF4 in different plasmid-transfected Ins-1 cell. Protein levels were normalized to β-actin. (I) RT-qPCR analysis of the expression levels of Atf4 mRNA level in different plasmids transfected Ins-1 cell. The tunicamycin treatment (5 μg/mL) was used as a positive control for ER stress, and chemical chaperone 4-PBA (300 μm/L) was used as an ER-stress reliever. (J) RT-qPCR analysis of the expression levels of Nrf2a, Nrf2b, and Gstp1 mRNA levels in different plasmids transfected Ins-1 cell. (K) Working model for the molecular mechanism of new HNF1a variant resulted in β-cell dysfunction. A schematic that showed how the new variant of HNF1a resulted in MODY3. HNF1a-Q125ter induced ER stress through upregulated p-PERK/p-eIF2a/ATF4 and resulted in β-cell dysfunctions, including decreased β-cells numbers, decreased insulin expression, reduced insulin granules, and impaired insulin secretion. Results are represented as means with standard errors; * p < 0.05, ** p < 0.01, *** p < 0.001, and **** p < 0.0001. One-way ANOVA. All experiments were conducted at least three times. WT, wild type; ER, endoplasmic reticulum; PERK, protein kinase R-like ER kinase; eIF2a, eukaryotic initiation factor 2; ATF4, activating transcription factor 4.

Acknowledgments
This image is the copyrighted work of the attributed author or publisher, and ZFIN has permission only to display this image to its users. Additional permissions should be obtained from the applicable author or publisher of the image. Full text @ Int. J. Mol. Sci.